What is Trend Trading and How to do it to make profits? Table of Contents
- What is Trend Trading?
- How to determine the trend?
- How to ride the waves of the trend?
- Technical Analysis = Trend Indentification
- History repeats itself
- Know the Macroeconomics
- Conclusion
- What are the elements of good strategy?
- Know the risk reward ratio
- An example of a risk-benefit ratio
- The importance of a risk: the reward percentage
- Key probability
- Choose one for you
What is Trend Trading?
One most popular saying in trading – and you’ve probably come across it before – is ‘the trend is your friend’.
What it means is: trading in the same direction as the trend, you have a higher probability of getting positive results.
Imagine a wave moving towards the shore; The easiest thing a trader can do is ride on top of the wave, not swim against it.
Of course, a trend can change at any time, so you can use technical indicators to try to determine where a change in direction is likely to occur.
All financial markets move in two different trends; up or down. When the markets are not in a trend, they move sideways, where there is a battle between the sellers and buyers. Correctly identifying the type of trend in a market can present great trading opportunities.
1. A bull market
If the market is on the rise, you can consider buying from this market. The key is to identify the right time to enter a buy position. The ideal would be to enter the buy position as low as possible, to maximize its growth potential. Some traders can wait for a pullback (a small dip in the market), but this carries the risk of waiting too long to enter the market and the opportunity for further rallies may be missed.
A bull market, also known as a bull market, shows a series of higher highs. In other words, each bottom (bracket) is taller than the one before it.
2. A bear market
Contrary to a bull market, if a market is falling you can consider selling that market. To maximize your chances of profitability, you need to enter that market as high as possible.
A bear market, also known as a bear market, is where the market creates lower lows and lower highs.

What is the Most Profitable Strategy?
How to determine the trend?
Conventional technical analysis says that during an uptrend, buyers push prices, driving values to higher and higher highs. This also applies during a downtrend, where traders take short trades with lower and lower lows. Therefore, the easiest way to identify a trend is to connect two highs or lows with a line.
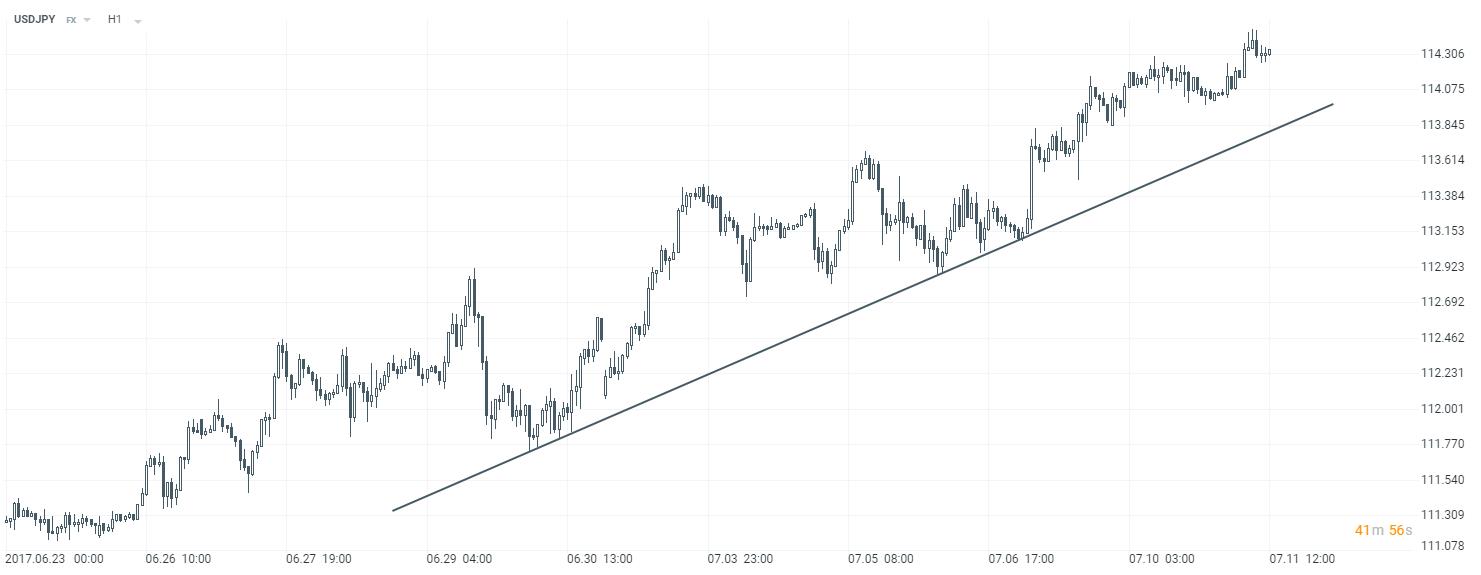
However, markets don’t always trade-in clear trends 24/7. There are periods of stabilization in all markets, which are also known as lateral trends.
A market moves sideways when it is at a point of indecision and buyers or sellers are at a standstill. Here, most traders are faced with two possible strategies; range trading or awaiting a breakout.
As can be seen in the example below, the EURUSD was trading sideways before a downtrend set in and sellers dominated buyers, driving prices down.
One of the most important things in identifying a trend is determining its time frame. Generally, when analyzing a long-term trend, it is necessary to do so on a long-term chart. However, for intraday purposes, short-term charts are the most appropriate. Large large operators could be interested in the fate of a currency or the company over a period of months or years. For smaller traders, however, a weekly chart can be used as a ‘long-term’ reference.
How to ride the waves of the trend?
By definition, trend analysis is based on historical price movements. That means that traders are looking in the past to predict the future.
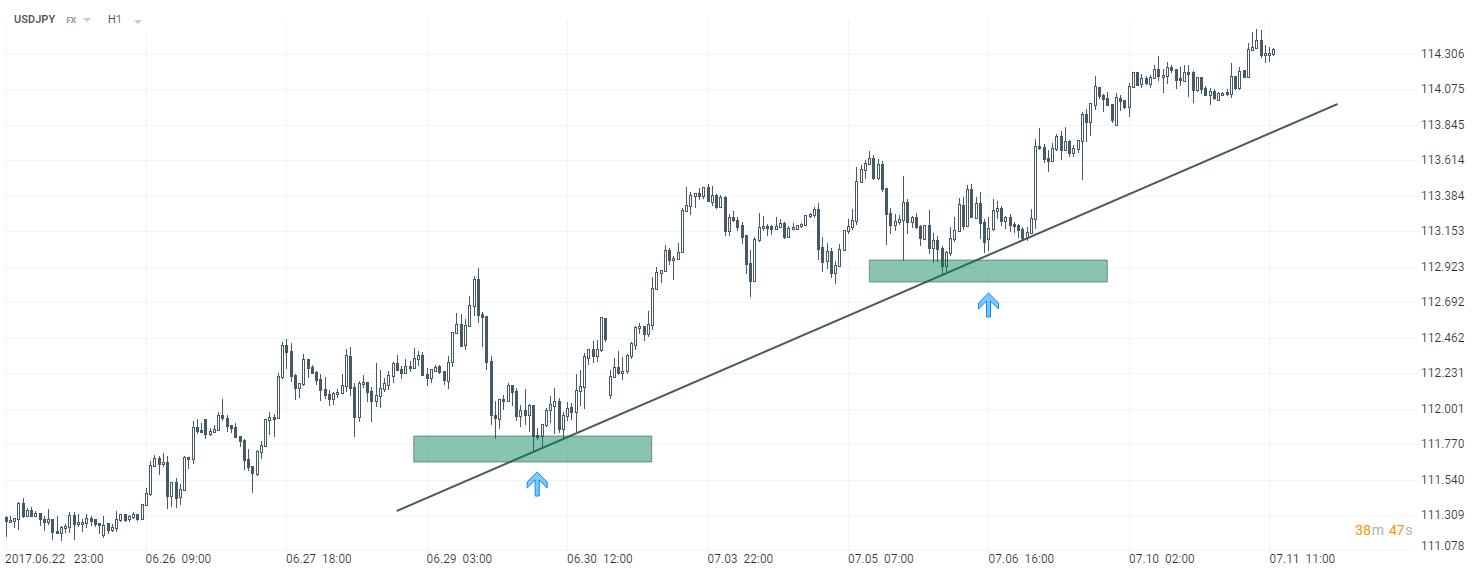
Knowing the direction of the trend does help in taking positions, but it must be taken into account that markets tend to move in waves. These waves are impulses when they go in the same direction as the trend and correction waves when they are against the trend.
3 Golden Technical Analysis Patterns for Forex
Technical Analysis = Trend Indentification
Generally speaking, there are two approaches that traders use to determine whether a market will go up or down. These are known as fundamental analysis and technical analysis. It is a similar approach to when shopping for a car. You can analyze its price, but on the other hand you can see its engine, chassis and many more.
While fundamental analysis focuses on the economic information of a company, product or currency, technical analysis focuses on the graph to predict future price movements.
As one of the most popular methods used by traders today to help identify trading opportunities, there are three principles of technical analysis:
- The market discounts everything
- Prices move in trends
- History repeats itself
The technical analysis only takes into account the price movement, ignoring the fundamental factors, since it is assumed all these factors that affect the price are considered within these movements. Therefore, all that needs to be examined is the price itself.
Of course, an unexpected event – such as a natural disaster or geopolitical tensions – can affect a certain market, but a technical analyst is not interested in why. A technical analyst focuses on the chart itself and the shapes, patterns, and formations that occur on the chart.
What is the Best Forex Trading Method?
History repeats itself
In technical analysis, price movements tend to follow trends. This means that after a trend has been established, future price movement is more likely to be in the same direction. Most technical trading strategies are based on this concept.
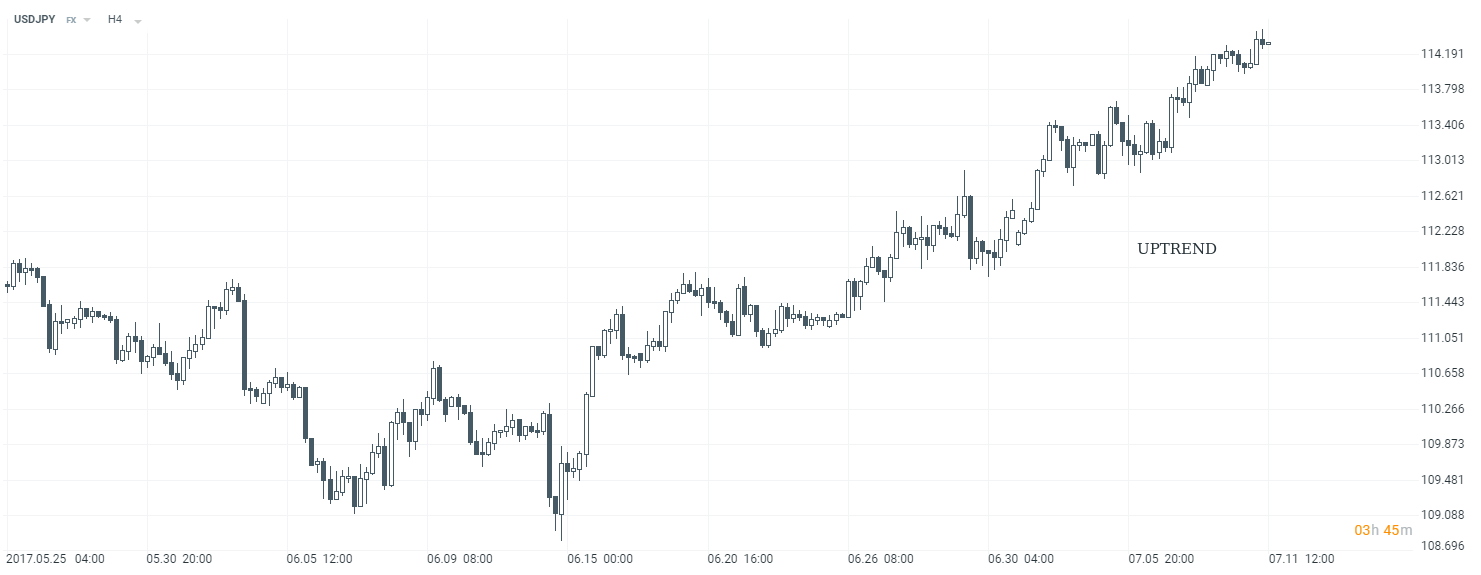
The cornerstone of technical analysis is the belief that history tends to repeat itself. For example, if the EURUSD was higher before the Fed meetings, a trader will buy the pair before the next interest rate decision in the United States. As such, technical analysts use historical price data to help forecast where prices are likely to head. This is where support and resistance levels come into play.
Charts tend to create shapes that have occurred historically, and analysis of past patterns helps technical analysts predict future market movements. This principle focuses on the belief that the technical analyst is very connected to probability and the analysis of historical forms gives the advantage before opening a trade. These forms are known as price patterns:
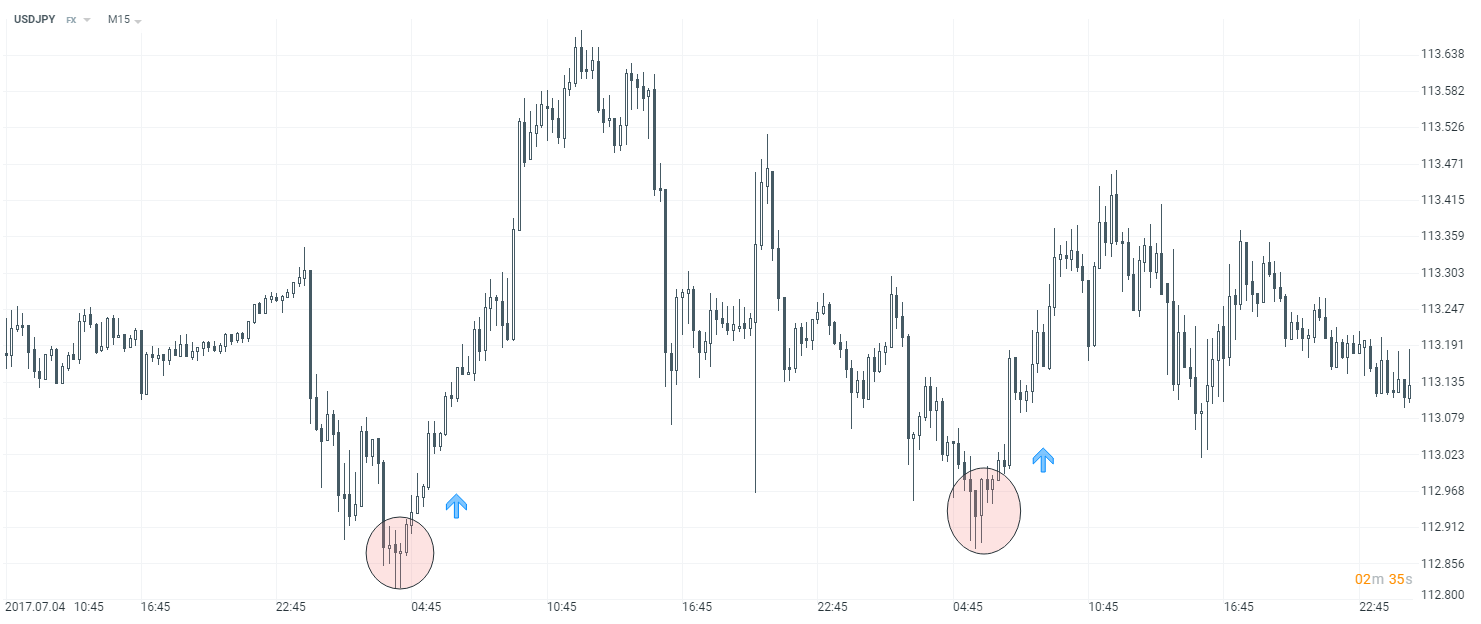
Technical analysis is the practice of forecasting future price movements based on examining past price movements. Technical analysts believe that if the DAX was on the rise recently, even more, can be gained in the future as it is on an uptrend. There are many different techniques for identifying trends, but like weather forecasting, the results of technical analysis do not cover all possible eventualities. Instead, technical analysis can help investors to anticipate what is likely to happen to prices in the future.
How much profit and loss could you make by trading Forex?
Know the Macroeconomics
An important part of fundamental analysis is related to the publication of macroeconomic data. While some indicators have a greater impact than others, the release of data that takes the market by surprise – either by being released in advance or exceeding expectations – can cause considerable market volatility.
Let’s start with the macroeconomic indicators that can drive the market.
1. Employment – the pulse of an economy
Perhaps one of the most important indicators of the health of an economy is employment. That’s because it influences all aspects of economic activity, from demand to supply.
Unemployment rates show the percentage of the total workforce that is unemployed, but active in employment and willing to work. A constant increase in unemployment levels is a manifestation of a deteriorating economic situation in the country, negatively perceived by financial markets as a signal to withdraw from the currency. Typically, the market concludes that the higher the unemployment level, the weaker the currency.
Follow Employment data releases with XM’s Economic Calendar
2. Non-Farm Payrolls (NFP)
One of the most important and most impactful data in the markets is the non-farm payrolls of the United States. Nonfarm payrolls are released every first Friday of the month, outlining new nonfarm sector jobs and the unemployment rate for the previous month.
Because consumers account for almost 70% of economic activity, the state of the labor market is of utmost importance to the general well-being of the country. An improvement in the NFP data indicates that the US labor market is strengthening, improving the prospects for the US economy, and therefore a positive effect on the US dollar.
A worse-than-expected figure in the NFP may have the opposite effect, affecting the outlook for the US economy, weakening the dollar and US stocks. It can also cause an increase in the price of gold, as it is considered by investors as a safe haven instrument.
Follow NFP data releases with XM’s Economic Calendar
3. Inflation – key to central bank decisions
The main objective of central banks is to promote price stability in the economy. Price stability is measured as the change in inflation, so investors monitor inflation reports to determine the future course of central bank policies.
CPI: it is probably the most important indicator of inflation. It is a statistical estimate constructed by using the prices of a sample of representative items whose prices are collected periodically. The CPI simply measures the rise in the prices of goods and services and is calculated for different categories and subcategories.
If the release of the CPI is higher than expectations, this means that inflation pressure is high and the central bank could raise interest rates, which could lead to an increase in the value of the currency.
Generally speaking, central banks try to counteract a rise in inflation with higher interest rates, which can lead to a strengthening of currencies. A low inflation rate, on the other hand, is offset by lower interest rates, which can lead to a weakening of the currency.
Follow Inflation data releases with XM’s Economic Calendar
4. GDP – the true color of an economy
GDP- orGross Domestic Product- is the broadest indicator of a country’s economy and shows the total market value of all goods and services produced in a given year. GDP Impacts of Personal Finance, Investments, and Employment Growth. Investors look at the growth rate of a country or economy to decide whether to adjust their asset allocation. They also compare the growth rates of countries with each other to decide where the best opportunities might be. This strategy includes buying shares in companies located in fast-growing countries. For example, if you see that the GDP in Germany is increasing rapidly and that the economy outperforms others, you could buy a CFD based on the DE30 (Underlying Dax, the index of the German stock market),
Follow GDP data releases with XM’s Economic Calendar
Conclusion
Every day, almost every hour, a large amount of macroeconomic data is released – so it’s easy to get overwhelmed. However, as a trader you have to know what figures can influence your open positions and what is really worth looking at. At the beginning of your trading journey, it is worthwhile to focus on the three indicators mentioned above, before digging deeper into other data, such as consumer confidence, company surveys, or even retail sales.
What are the elements of good strategy?
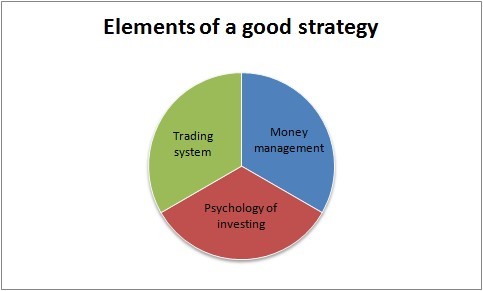
A trading system is the constant application of rules that are part of a certain strategy, such as specific entry and exit points or always opening positions in the direction of the prevailing trend.
Psychology is the work on your emotions that are born during trading and investing. Learn more about the psychology of trading.
Money management is the part of the strategy that determines the size of the position, the size of the leverage and the levels of Stop Loss and Take Profit. Good money management is an essential part of long-term trading success.
Consideration of these factors will play an important role in your ability to maximize profits and minimize losses.
Let’s analyze a situation in which these three elements are being ignored. In this example, let’s say your account funds are $ 5,000 and you sell EUR / USD with a trade size of 4.59 lots and a leverage of 100: 1. Here you are using a significant part of your funds in this position ($ 4,998.51), giving you a narrow margin in case of any negative price movement. Each pip move will generate a profit or loss of $ 45.90. Let’s see what happens next.
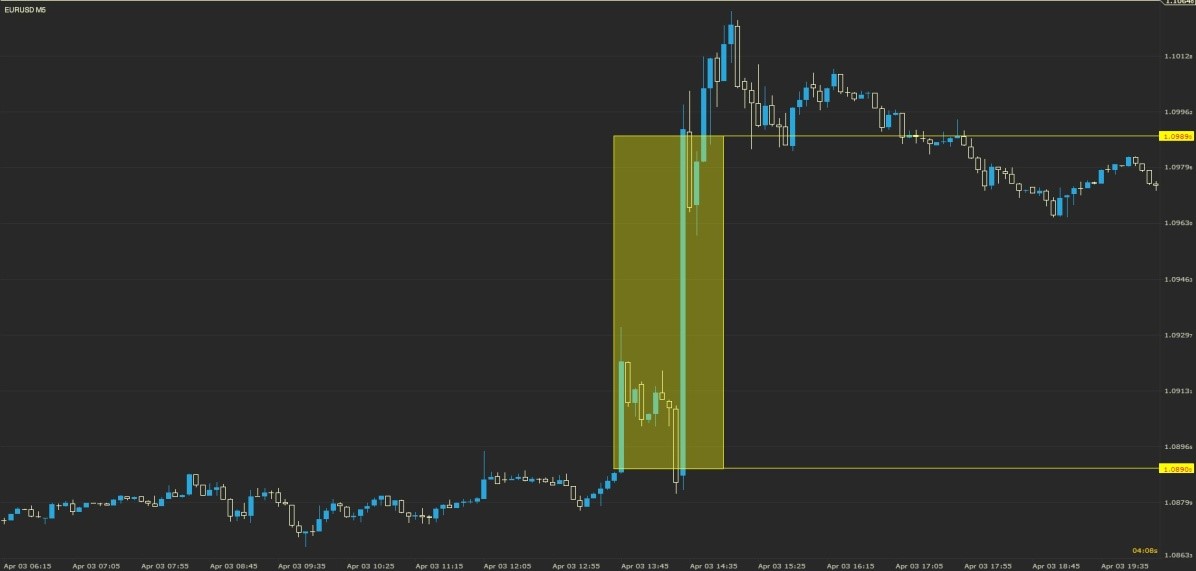
Some market data react by strengthening the euro, which is gaining 100 pips against the dollar. This move puts the trade at a loss of $ 4,590 in just a few minutes, which accounts for the majority of the funds in the account and it is practically impossible to recover the account.
This trade is a clear example of a position too large for your account funds.
Even the best traders suffer losses at some point. It is part of trading. The key is to limit your losses to a manageable amount. In this way you will have the opportunity to continue in the market for longer, increasing your chances of successful operations. One way to ensure the balance between risk and reward is to stick to a 2: 1 risk-reward ratio, where the desired gains are always twice your maximum loss. So even if you suffer three losing trades, only with two successful ones do you ensure that your total gains exceed your losses, as long as you stay within this benefit: risk ratio.
Let’s look at two traders who started with $ 10,000 and use a 2: 1 risk-reward ratio, but apply very different money management strategies in their trading. The first trader uses a very aggressive method, risking 60% of his capital in each operation, and seeks to obtain a profit of 120%. The second trader is more conservative, risking only 5% of the funds in his account. Suppose both traders have the same set of ten trades, and that every second trade is a winner.

Strategy effectiveness
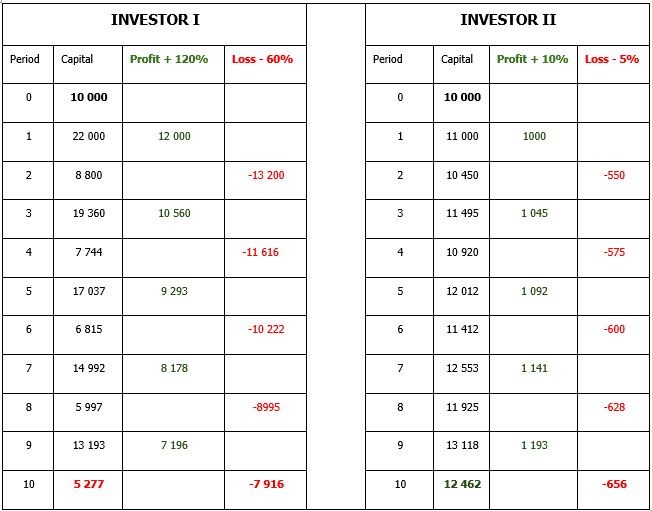
These tables analyze the results of both cases, with traders managing different levels of risk.
Beyond the fact that both strategies have equal success rates, the same initial capital and the same return: risk of 2: 1, for a very different modality of money management, the final result differs a lot. The aggressive method of the first trader resulted in a total loss of 47% while the second trader reached a total profit of 25% at $ 12,462. So you can see how a minor adjustment in your risk management methods can pay off.
If you want to know more about risk management, you can register for XM’s online webinars and learn from XM’s specialists.
Know the risk reward ratio
A risk-reward ratio is used by many traders to compare expected returns. To calculate the risk-reward ratio, the amount you can lose if the price moves in an unexpected direction (the risk) is divided by the amount of profit you expect when you close your position (the reward).
Some of the most popular ratios are 2: 1, 3: 1, and 4: 1 and these will change depending on the strategy of the operation. Of course, there are other aspects that can affect the risk of a trade, such as money management and price volatility.
An example of a risk-benefit ratio
Let’s say you decide to buy shares of ABC. You ‘buy’ 100 lots, equal to 100 shares, which are priced at £ 20 for a total position value of £ 2,000 – on the basis that you believe the share price will reach £ 30. Set your stop loss at £ 15 to ensure your losses do not exceed £ 500.
In this case, then, you are willing to risk £ 5 per share to make an expected return of £ 10 per share after closing your position. Since you’ve risked half, your risk ratio is 2: 1. If your earnings goal is £ 15 per share, your risk ratio would be 3: 1, and so on.
It is important to remember, however, that while the risk/reward ratio helps manage your profitability, no indication of probability is given.
The importance of a risk: the reward percentage
Most traders do not aspire to have a risk/reward ratio of less than 1: 1. A positive reward: risk ratio such as 2: 1 would dictate that your potential profit is greater than any potential loss, which means that even if you suffer a loss, you only need one winning trade to make a net profit.
We have included a table below to highlight the different risk/reward ratios and their impact on your total profit and loss. The table below assumes 1 equals £ 100 and has a 50% win rate across 10 trades.
The potential benefits of having a positive risk/reward ratio and how this can affect your bottom line can be clearly seen from the table below.
Key probability
We mentioned “probability” briefly above, but let’s take a more in-depth look.
Let’s say that of the last 100 trades, 60 were profitable. That gives you a 60% chance. The probability depends on your trading system, as well as your emotional ability to stick to that system.
What’s more, the main objective of every analysis performed is to maximize the opportunity to enter a high probability trade. If you are looking for a specific technical pattern, you are trying to maximize probability. Why? Because as it appears it must be followed by a specific price movement. By looking for a pattern, you look for a higher probability of making a profit.
How to Risk Management in the Forex
Choose one for you
Each trader has their own trading strategy and risk-reward ratio that is best suited for them. One of the challenges of negotiating is finding a system that works for you.
If we think of risk tolerance on a spectrum, where do you think it would be? Are you more conservative or are you open to taking more risks and enjoying the adrenaline rush?
The most important thing is to choose a risk and reward system that is manageable for you and that ensures that your trading is as profitable as possible. There are no specific rules – you just have to find the perfect one that suits your strategy.
How to apply Fibonacci Retracement Trading Strategy
Please check XM official website or contact the customer support with regard to the latest information and more accurate details.
XM official website is here.
Please click "Introduction of XM", if you want to know the details and the company information of XM.


 IronFX

FXGT Broker Review: A Leader in High Leverage Forex and Cryptocurrency Trading
Comment by whatisgoingonTRUMP
February 17, 2025
Trump’s team holds 80% of the $TRUMP token supply, giving them the power to influence prices and put investors at risk. A crypto controlled by one group? Doesn’t seem very decen...