What is Relative Strength Index (RSI) indicator?
From the basic usage point of view, the RSI indicator can clearly indicate short-term market long-short sentiment, which is helpful for the judgment of the market trend, but we need to think about other methods for prompting the timing of entry. It is a good way to superimpose two RSI indicators.
In common stock software, RSI indicators rarely appear alone but are often used in the form of three stacked ones. In this way, the weakness of the RSI indicator’s lack of stability has been relatively weakened, but the author found after experimenting that in the faster-running foreign exchange market, the three-line RSI indicator would not respond in time. And we can take second place and choose the two-line RSI indicator. However, the two-line RSI indicator is not used as an aid to other indicators but can form a complete trading system.
The default parameter of the RSI indicator on each foreign exchange platform is 14, where the RSI indicator parameters of the two lines are 12 and 2 respectively. Note that this two-line RSI indicator is superimposed in a window, and you can refer to the previous MACD+CCI (add RSI (2) or RSI (12) first, and then use the menu bar “Navigation”-“Technical indicators” -“Oscillator”-“Relative Strength Index” to drag another RSI indicator to the corresponding window).
The usage of this two-line RSI indicator strategy is not complicated.
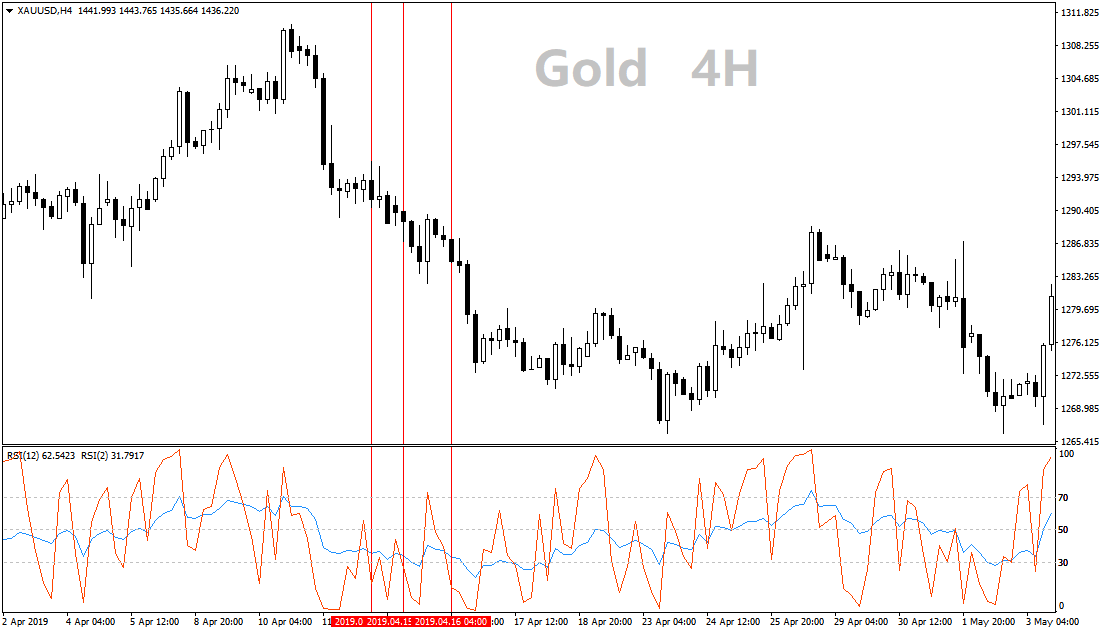
1) RSI (12) is above 50, preferably a slight upward shift. When RSI (2) crosses RSI (12), it is the time to enter the market.
2) If RSI(12) is below 50, it is better to move down slightly. When RSI(2) crosses RSI(12), it is the time to enter the market.
In specific use, the RSI (12) above or below 50 is used as the basis for determining the direction of long and short (it must be clearly above or below 50, and it is not suitable to trade at the position of 50), and the RSI indicator Considering the direction, you can usher in the market faster. Note that this market is mostly short-term. In addition, under the two-line RSI, there may be continuous entry prompts within a short period of time. The author recommends choosing one of them, and there is no need to increase the position.
In addition to the above routine operations, considering the existence of the RSI indicator as an overbought and oversold indicator, it may be possible to look for more opportunities, but the risk is high.
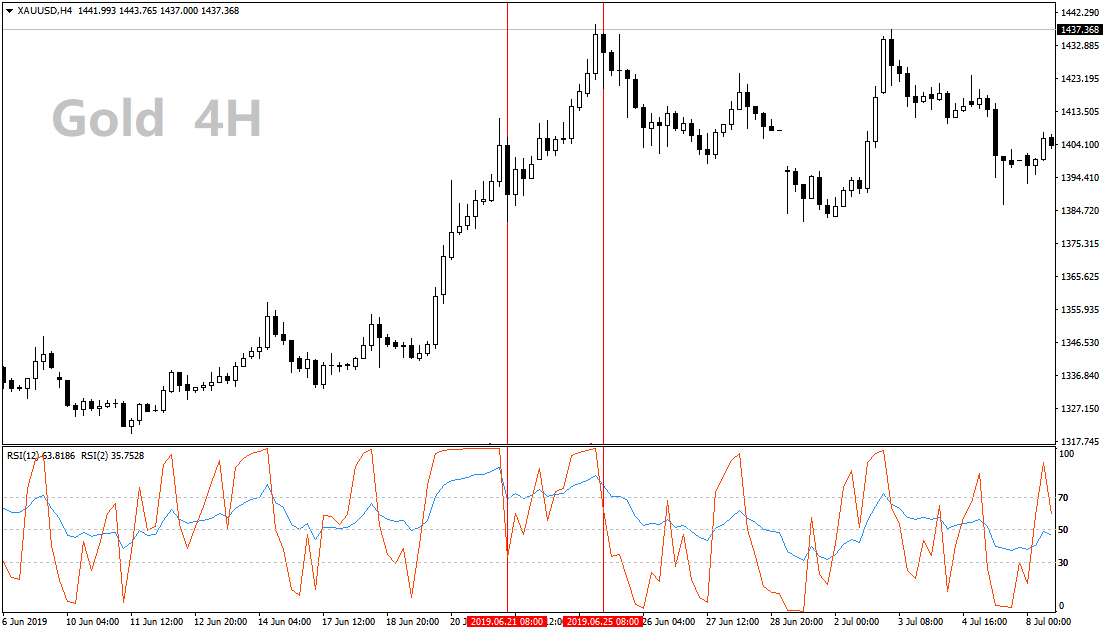
3) RSI(12) is above 70 and obviously far away from 70. When RSI(2) crosses RSI(12) in the overbought zone, the short order opportunity can be considered.
4) RSI(12) is below 30 and obviously far away from 30. When RSI(2) crosses RSI(12) in the oversold zone, you can consider the opportunity to buy more orders.
It is relatively difficult to grasp the entry opportunity in the overbought and oversold zone. It is recommended to match the K-line pattern, and it is a typical reverse order. It must be strictly stopped, and safe friends should use less.
And for appearances on the timing considerations, is more simple, under normal circumstances, RSI under 50 to wear (12), is more than a single appearance, the same token, when the RSI (12) When wearing 50, an empty single will appear. Corresponding to the situations of (3) and (4), there is no clear signal, and it can only be accepted as soon as it is good.
The two RSI indicators are used together so that the RSI indicator can prompt entry. Accordingly, the dual-line RSI indicator is no longer suitable for assisting trend judgment, or vice versa. Before using the dual-line RSI indicator, you may wish to observe the disk first.
Finally, I will add that although the two-line RSI indicator is a complete strategy, it is not suitable for long-term trading due to its small parameters. For the applicable main cycle chart, the author recommends 1H and 4H. What’s left is that everyone should run in a simulated trading strategy.

 Deriv
Deriv  AdroFX