
How to use Fibonacci retracements
I believe that many people have heard of Fibonacci. If not, they must have heard of the golden ratio. They have a very important use in trading. They can help us find some potential support and resistance positions, and they can also help us find stop-profit and stop-loss prices.
Fibonacci retracement originated from the Fibonacci sequence, which was introduced by the mathematician Leonardo Fibonacci and refers to such a sequence: 1, 1, 2, 3, 5, 8, 13, 21, 34…, we can find that each number in this sequence is equal to the sum of the previous two numbers.
If we dig deeper, we will find that the ratio of each number in this series to the previous number is 1, 0.5, 0.666, 0.6, 0.625, 0.615, 0.619, 0.6176…, that is to say, the lower the series is, The closer the ratio is to a fixed number: 0.618.
In addition, there are many magical features in this sequence. For example, the ratio of each number to the second number after it is infinitely close to 0.382, and the sum of 0.382 and 0.618 is exactly 1. The number 0.618 is called the golden ratio, and it is ubiquitous in art and nature.
The application of the golden section in trading
The golden section is embodied as a Fibonacci retracement in trading, which divides a complete downward or upward wave into 23.6%, 38.2%, 50%, and 61.8%. When the price starts to correct the original downward or upward wave, it will often encounter some resistance or support near these dividing lines.

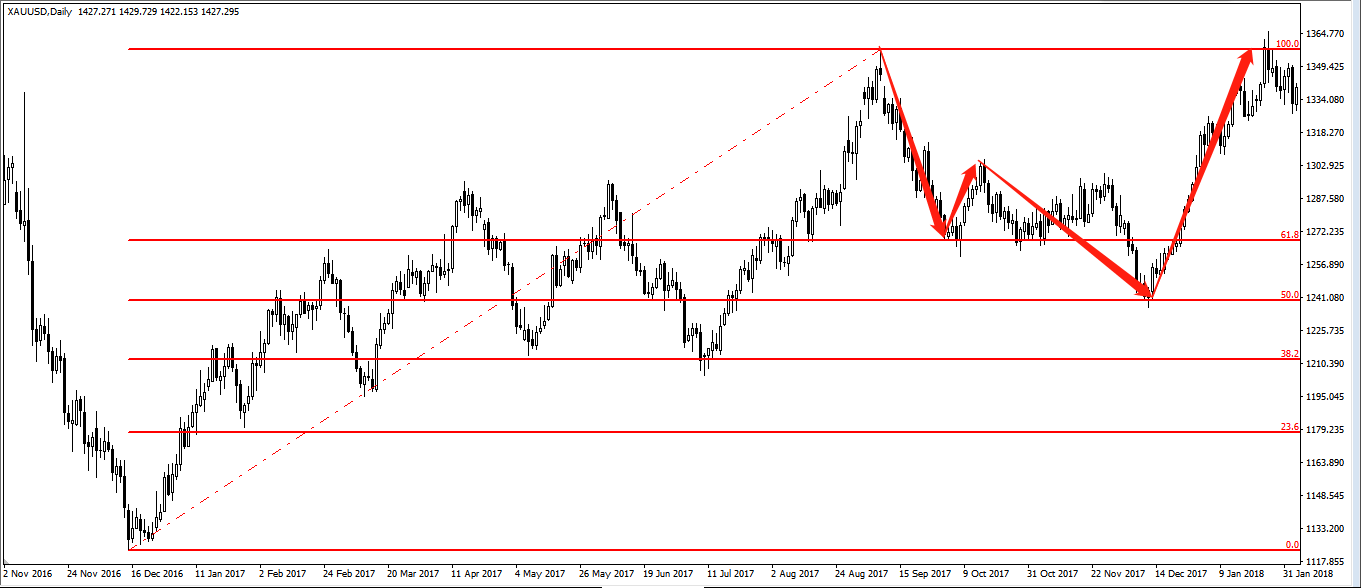
Such as the daily chart of gold in the figure, when prices stepped back and met the Fibonacci 61.8% Fibonacci resistance correction after a strong rebound again. Using the same daily chart of gold, if we keep the starting point unchanged and stretch the focus back to the high point on July 6, 2016, we will find that the price has encountered the 61.8% Fibonacci retracement of this round of rising waves. There was also a very strong rebound.

If we take the July 6, 2016 high as the starting point and December 15, 2016 as the endpoint, we can find that when the price corrected this round of falling waves, it happened to have come to near 61.8% and showed strength. Larger backtracking.

If we set December 15, 2016 as a starting point, to September 8, 2017, as the endpoint can be found, this price correction in a rising wave At the time, it happened to be around 61.8% and then there was a relatively strong backstepping, and then it turned to the upside again when it encountered a 50% Fibonacci retracement.
Using Fibonacci retracements precautions
But we do not be misled by the above examples, the author had used a few examples of the above just to find some typical cases Make it easier for everyone to understand the importance of Fibonacci retracements. In actual trading, not every time the price encounters a Fibonacci retracement, there will be an immediate reversal trend.
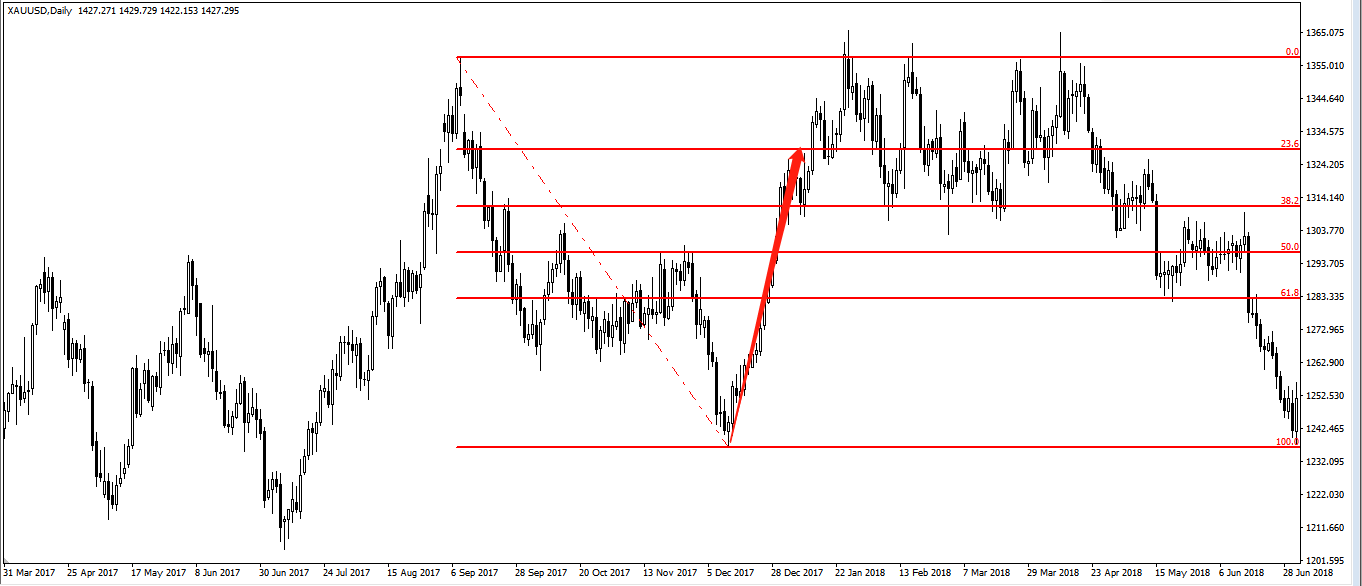
Such as in the figure, when prices encountered 61.8% Fibonacci Fibonacci correction did not show any valid stepped back, but continue to climb along the original upward trend, And set new highs all the way. Therefore, we can summarize the use of Fibonacci retracements in trading as follows:
1.61.8%, 38.2% and 50% are very important
When the price encounters these resistance positions, we must be prepared that the price may appear Preparation for stepping back and reverse correction. But it is not that as soon as the price is corrected, we have to draw the Fibonacci retracement line. Only when the price correction exceeds 23.6%, we will draw the Fibonacci retracement line.
The pattern of prices near key locations is important
If we review the above figures, we can find that every time the price appears a clear reversal pattern near the key price, the price will have a stronger reversal trend (see Figure 1 for bearish engulfing, Figure 2). Is a bullish Pin Bar, Figure 3 is a bearish engulfing, Figure 4 is a bullish engulfing and a bullish Pin Bar).
When we go long or short at key positions based on these patterns, we can set the stop loss at the high and low points of the corresponding pattern. For example, when we are long based on a certain bullish engulfing, we can set a stop loss at the lowest point of the engulfing. The take profit can be seen near the next support resistance or the next Fibonacci retracement price.
When the key Fibonacci retracement level coincides with other support and resistance
The Fibonacci retracement level is often some of the more important support and resistance, but it is only one of the many support and resistance, and other support and resistance effects should be treated the same. . If these key callback price levels coincide with other previous highs or lows, and integer thresholds, then there is a great probability that the price will not be able to support or resistance at this time.

For example, it is in the above figure, which is near the Fibonacci retracement key price in Figure 1. This 61.8% Fibonacci retracement also coincides with the low point in the previous ellipse, which is near the low point of March 28, 2016.

 IronFX
Comment by Diletta
March 26, 2024
Awesome bonuses, good leverage. A few hiccups, but support rocks!