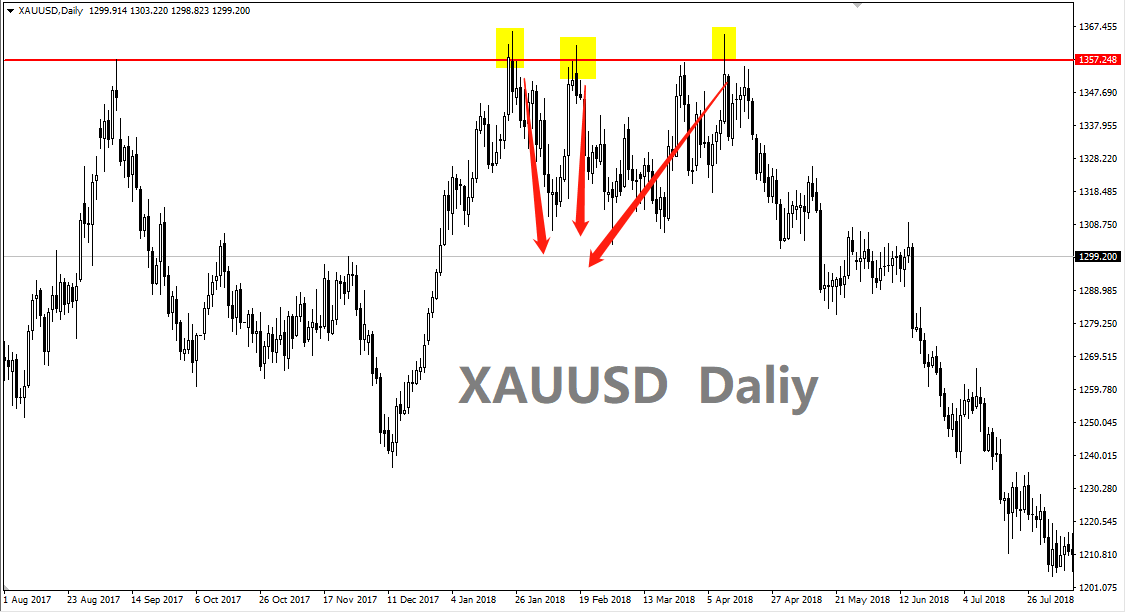
The problem of breakthroughs in trading has always troubled us: worry about false breakthroughs but also worry about real breakthroughs. In fact, for breakthroughs, we don’t need to guess the true or false of the breakthrough, but to clarify how to deal with the real or false breakthrough. Loss trading is a small way to deal with false breakthroughs.
The so-called breakthrough is generally for key positions, and the positions that need to be paid attention to are also those that are meaningful to confirm or continue the trend. From the actual disk observation, we can see that there are not many real breakthroughs at key positions and many false breakthroughs. And in some very important key positions, it is very likely that a small breakout will sweep away a batch of stop losses first, but the subsequent breakthrough is unknown. So it’s not easy to break through trading.

Is it possible for a false breakout trade?
There is one way: losing trades, also known as false breakout trades.
Of course, if every time it is assumed to be a false breakthrough and a reverse transaction is performed, then once it is wrong, there may be obvious losses, so before the actual transaction, it is still necessary to filter through certain conditions.
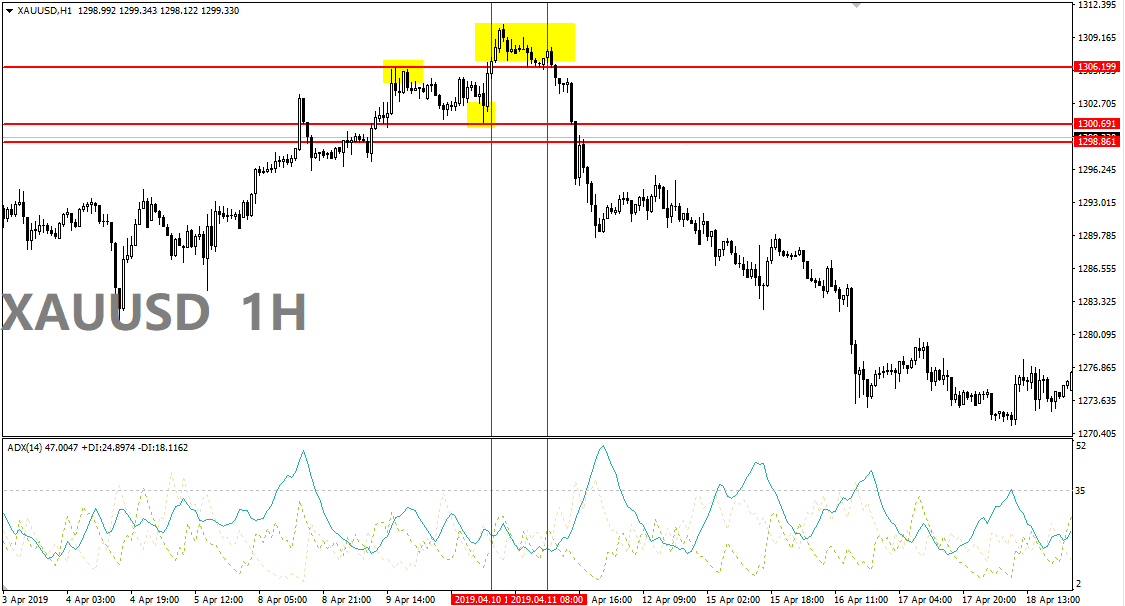
When the strength of the trend weakens, the probability of false breakthroughs is often relatively large. Of course, this situation is more likely to occur under severe overbought and oversold conditions. Loss trading uses an indicator, the ADX indicator (the indicator moves up to indicate that the trend is stronger, and down indicates that the trend is weaker). When the indicator points to a weaker trend, you can try to lose money.
So how does the losing trade work?
Speaking of the previous, the best daily chart for losing trades is to confirm the overall situation of the disk, and the 1-hour chart is used to confirm the entry price. In other words, consider the 1-hour chart for actual market entry.
So the specific method is: multi-single entry (1-hour chart, with the use of ADX indicator, parameters are default parameters):
- ADX indicator is below 35, it is best to move down.
- Waiting for the market to drop to at least 15 points from the previous day’s low.
- Place a long order (BUY STOP) at about 15 points above the high of the previous day, with a stop loss of about 30 points and a stop profit of about 60 points.
Short entry (the idea is the same)
- The ADX indicator is below 35, it is best to move down.
- Wait for the disk to break through the previous day’s high at at least 15 points.
- Place a short order (SELL STOP) at about 15 points below the low of the previous day, with a stop loss of about 30 points and a stop profit of about 60 points.

Attention must ensure that when the disk is slightly below the 35 break ADX indicator, as for ADX indicator when admission was not required under 35, even on this location better.
However, after actual trading, the author found that loss trading is inherently easier to achieve with the trend. That is to say, it is better to find loss trading opportunities in our false breakthroughs during the callback process, rather than going against the trend The entire megatrend forced entry into the reverse order. This method is also a typical intraday transaction, especially a true contrarian transaction, and it must be profitable and go. So, traders who do intraday trading can try to use this loss trading during the callback process of the disk trend. At the same time, please note that you need to be very cautious when trading against the trend.


 Deriv
Deriv  AdroFX