Understanding Forex Fundamental and Technical Analysis - For Dummies Table of Contents
- What is fundamental analysis?
- Natural disasters
- Economic Indicators
- Main economic indicators
- 1. Building permits
- 2. Consumer Confidence Index (CCI)
- 3. Consumer Price Index (CPI)
- 4. Durable goods orders
- 5. Labor cost index
- 6. Gross Domestic Product (GDP)
- 7. New construction volume
- 8. Changes in industrial production
- 9. Initial jobless claims
- 10. Interest rate decisions
- 11. Money supply
- 12. Non-Farm Payrolls Report (NFP)
- 13. Personal income
- 14. Producer price index
- 15. Retail sales report
- 16. Trade balance
- 17. Unemployment rate
- Technical Analysis
- Trend Lines
- Support and Resistance
- Forex Channel Trading
- Types of Charts
What is fundamental analysis?
Every trader wants to know where the price is going. However, in order to get the most realistic answer to this question, it is necessary not only to observe the charts on the trading platform but also to constantly observe what is happening in the world.
Key referendums, presidential comments, or the release of negative statistics can all have a huge impact on the country’s exchange rate.
You may have heard something similar: “The pound fell because of the news… the euro against the dollar rose because of the news…”.
If a well-known company performs poorly this quarter and profits are lower than expected, it will make investors feel uneasy: its stock will no longer be so attractive, it will begin to be sold off, and its share price will fall.
The prolonged rainy season in the United States will ruin the cotton harvest: the amount of cotton will be less than planned, and the price will soar.
All of these are important factors that are inseparable from trading and are called fundamental analysis.
What events should be considered?
- Economic, geopolitical and social phenomena;
- Economic prospects and market sentiments of a particular country;
- Natural disasters (extreme weather, earthquakes and hurricanes that cause severe damage);
- Periods of wars and conflicts between major countries;
- Political events ( Presidential elections, referendums, forums);
- Important statistics (economic indicators) published by industry or country.
The list of Important Economic Data
Natural disasters
When we talk about natural disasters, we are referring to extreme weather conditions such as floods, earthquakes, hurricanes, and tsunamis. Mass casualties, infrastructure destruction, and widespread fear can adversely affect a country’s economy, especially because the government will have to allocate a considerable recovery budget.
As a result, the country’s currency inevitably weakened. For example, after the catastrophic earthquake and tsunami in 2011, which resulted in 15,000 deaths and thousands of injured and missing, the yen fell 0.4% against the dollar.
A country involved in a military conflict in a war should provide funds for armaments, respond to losses, and even issue warnings, while at the same time controlling the public awareness that arises from fear and chaos. All these will undermine economic stability.
Therefore, prolonged confrontation may cause severe market volatility and cause the currencies of warring countries to depreciate.
The highlight of the political factor is the presidential election. This event usually causes violent fluctuations in the national currency. If the upcoming elections result in a sufficiently high possibility of a government change, then political instability will cause the exchange rate of the national currency to fall.
Other important events include comments by politicians after the meeting, unexpected management decisions, scandals, international sanctions, confrontations, and the results of negotiations between leaders of various countries.
The main tool for professional traders of economic indicators is the economic calendar. When the actual statistics are released, they will appear in the rightmost column immediately. It also lists the release time, indicator name, description, past value and forecast value.
Here are some examples of the most important economic indicators (marked with three exclamation marks on the calendar):
- Central Bank Interest Rate Decision
- Non-agricultural employment-population (NFP)
- Unemployment rate
- Consumer price index
- Gross Domestic Product (GDP)
How does the release of economic indicators cause price fluctuations?
To answer this question, let’s take the main employment data outside the agricultural sector in the United States as an example- the non-agricultural employment population. This is a monthly report reflecting the changes in the number of urban employment in the past month. The relatively high value is considered to be good for the U.S. dollar (USD) and promotes the growth rate ( the more jobs, the more money people have, the higher the purchasing power, the stronger the economy, and the more attractive to investment ).
The reverse is also true: lower-than-expected data usually causes the dollar to fall.
Generally speaking, macroeconomic indicators will not only affect one asset but multiple assets at the same time.
Although the non-agricultural employment population is directly related to the U.S. economy, it also affects the trend of the British Pound (GBP) or the Euro (EUR) because they are paired with the U.S. dollar (GBP/USD and EUR/USD respectively).
When is the best time to trade FX?
Economic Indicators
Whether you are trading currencies, stocks, indices or other financial instruments, it is important to first fully understand the situation in the relevant country. In particular, it is necessary to understand what forces affect the national economy and what kind of news needs to be paid attention to first.
The indicators (news) on the economic calendar can generally be divided into the following categories:
- Leading indicators
- Lagging indicators
- Sync indicator
such as leading indicators help predict future economic changes in a country. Any changes in their values are a warning that we will soon see similar negative (or positive) effects in other national departments.
Therefore, you can predict the upcoming recession, as central bank representatives usually do: they pre-determine the direction of development and adjust monetary policy by raising or lowering interest rates. Individual traders also use the same data to adjust their strategies.
Leading indicators mainly include:
- Building permits
- The more permits issued, the brighter the prospects for construction and other related fields. The growth of this indicator shows a decline in the future unemployment rate and an increase in housing loans.
- Consumer Confidence
- Index Overall, it shows whether people are prepared to spend money this month. It also helps to determine the employment field and the overall economic situation, and even production prospects.
- Applying for unemployment benefits for the first time
- During a certain period of time, there will be more or less unemployed people. In short, it affects GDP, taxes, consumer prices, etc.
Lagging indicators are different from leading indicators. These indicators reflect economic conditions that have changed over time. Traders use these indicators to confirm the strength of market trends. Since the economy has begun to develop in a certain direction, traders can create medium and long-term positions in accordance with the overall trend.
- The unemployment rate indicates how many people are currently unemployed in the country.
- The consumer price index shows the changes in consumer prices over time.
- The trade balance shows the value of imported and exported goods over a certain period of time.
such as synchronization indicators provide important information about current economic conditions. Synchronous indicators allow traders to analyze the current market trends in detail, allowing them to adjust their strategies according to development trends.
- Personal income
- Individual income.
- Retail Sales Report
- It reflects the changes in retail sales.
- Gross Domestic Product
- The total cost of all goods and services produced in the country in the past year or quarter.
7 Major Economic Events and How they impact the market
Main economic indicators
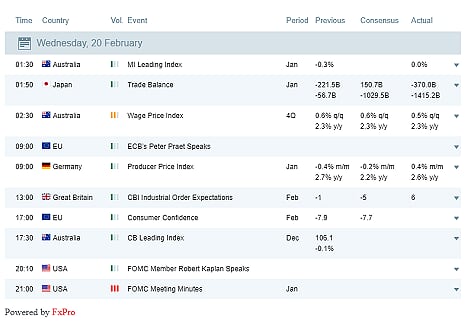
Open the economic calendar of fxpro.com and find news with two or three exclamation marks. These are the publications of statistics that have the greatest impact on the currencies of the relevant countries.
This means that about 15 minutes before the actual value of the indicator appears on the calendar, there will be a very strong and unpredictable upward or downward movement on the chart of the currency pair.
The main advice was given to novice traders-pay attention to the difference between the actual value and the predicted value. In addition, don’t forget that a quick price reversal may occur, so news trading also means the creation of quick orders (positions).
More commonly, you can follow US news (the news is the easiest for beginners to understand), and you can focus on the U.S. dollar- USD. If the US statistics are better than expected (better than analysts’ forecasts), then be prepared that the exchange rate of the euro against the dollar may fall: yes, in this case, the dollar exchange rate will rise, but be aware, It is the second place in the currency pair. As a result, the price of euros denominated in dollars will fall.
If you prefer clear trading, choose USD/JPY: The US dollar is the first currency pair, and the Japanese market (yen) has closed at this time.
If the published data will affect the growth of the value of the dollar, the currency pair will grow (direct dependence).
Access to Tickmill’s Economic Calendar
1. Building permits
This report includes the total number of building permits issued by the US government each month.
Why it is worth paying attention to this indicator can provide important clues to future economic conditions. For traders who invest in USD currency pairs, this report is an important leading indicator.
When will the data be released: between the 17th and the 18th of each month.
2. Consumer Confidence Index (CCI)
CCI shows how optimistic people are about the current and future economic situation. Consumers will receive a survey report related to their future purchases, and these results form the basis of CCI.
Why it deserves attention: Strong consumer confidence shows that living standards are improving. This means people can spend more money. In addition, it increased the turnover rate of the national economy, promoted the growth of the national economy, and endowed the country with currency value.
When will the data be released: the last Tuesday of each month.
3. Consumer Price Index (CPI)
This indicator shows how the cost of living in a particular country has changed: a range of consumer products will be evaluated, including food and beverages, housing, transportation, and healthcare. These data are often used to determine the level of inflation.
Why it deserves attention: This is a key lagging indicator. Traders can predict potential changes in interest rates based on it and make trading plans accordingly.
When will the data be released: every month.
4. Durable goods orders
This indicator measures the number of new residents’ orders for the production and supply of durable goods and large-scale goods (such as engines).
Why it is worth paying attention: This data shows the economic growth rate. The number of orders can reflect the future workload of the factory. In turn, this directly affects sales data and employees’ working hours.
When will the data be released: on the 20th of each month.
5. Labor cost index
This indicator determines the changes in wage levels, as well as bonuses and work benefits for all non-agricultural sectors. The data in the report was collected based on an employer survey.
Why it’s worth paying attention: This report is related to inflation data. Employee compensation is one of the company’s main expenditures. The Fed is also paying close attention to this index and relies to a large extent on it to choose the direction of national economic policy.
When will the data be released: every quarter.
6. Gross Domestic Product (GDP)
This is a report that measures the total value of all goods and services produced by a country in a year or a quarter. The publication of this data can cause major fluctuations in the currency exchange rate of the country: not only the United States publishes this data, but other countries (Canada, Britain, Japan, etc.) also publish it.
Why it is worth paying attention: This is a good opportunity to compare the economic growth rates of different countries and also to make predictions about the trend of specific currency pairs.
When will the data be released: every quarter.
7. New construction volume
The report measures the number of houses under construction last month.
Why it is worth paying attention to This indicator is directly related to economic growth. For example, the declining number of construction projects in the United States may herald an upcoming economic recession. At the same time, if the data increases, it may indicate that the country’s economy has entered a positive period, which will also affect the US dollar exchange rate.
When will the data be released: around the 17th of each month.
8. Changes in industrial production
Show how many goods a country produces in the current month. Generally speaking, statistical results involve the financial results of industrial companies, factories, mining, and energy companies.
Why it deserves attention: This data is considered a synchronization indicator. This means that any changes captured in this report are what is happening in the economic sphere. The publication of this data will indicate which sectors have observed growth: therefore, it is possible to determine the current trend of the national currency. This indicator reflects the changes in national employment levels, average income, personal income, and inflation data in advance.
When will the data be released: 11-12th of each month.
9. Initial jobless claims
This indicator shows how many people were unemployed last month.
Why it’s worth paying attention: The fewer new applications, the stronger the country’s economy and the more stable the labor market. The high level of employment leads to higher consumer spending and higher GDP figures. Therefore, if the actual value in the economic calendar is lower than expected, the price of the dollar against the yen is likely to fall.
When will the data be released: every Thursday.
10. Interest rate decisions
The central bank controls the interest rates for loans to other domestic commercial banks. This depends on the level of interest rates at which foreign investors invest in their own currencies.
Why it is worth paying attention: This value shows how the economy has changed over time and how attractive and strong the currency is (for example, the US dollar).
When to release the data: The eight major central banks (Federal Reserve, European Central Bank, Bank of England, Japan, Switzerland, England, Australia and New Zealand) release quarterly.
11. Money supply
Money supply measures the amount of money currently available for expenditure in a country’s economy.
Why it deserves attention: It is a leading indicator that allows investors to predict potential inflation levels and allows traders to understand the central bank’s further policies. The more funds available, the more confident the country will be, and the better it will be for its currency.
When will the data be released: Every Thursday in the United States.
12. Non-Farm Payrolls Report (NFP)
This professional report shows how many jobs are created by American companies. The survey results are grouped by industry but do not include positions in the agricultural sector.
Why it deserves attention: A higher employment rate may herald the expansion of a country’s enterprises, which will have an impact on the stock market. In addition, the growth of potential consumer spending will also lead to economic growth. The NFP reports working hours and average wage levels: if the data increases, it will lead to higher interest rates. If the data is better than expected, it will usually put pressure on the EUR/USD.
When will the data be released: the last Friday of each month.
13. Personal income
It measures the total income of all citizens of the country, including wages, interest, dividends, and annuities.
Why it is worth paying attention: This is a synchronous indicator that shows the intensity of consumer demand (how much money the consumer has). The more income, the better the economy: When personal income grows, people are more likely to consume, thereby returning it to the economy.
When will the data be released: after the 20th of each month.
14. Producer price index
It measures the price changes of products sold by national producers. The report covers all internal production but does not include imports.
Why it deserves attention: This is a signal of potential inflation and changes in economic policy. It is believed that any increase in producer costs will inevitably lead to consumer price increases. As the cost of goods and services increases, living standards will decline, so this report can be used as a leading indicator of inflation.
When will the data be released: Once a month, it will be released one week after the NFP data is released.
15. Retail sales report
This indicator measures changes in the value of retail commodities including food, clothing and automobiles.
Why it deserves attention: This is a leading indicator. The significant growth of the retail industry will bring more funds to the national economy, increase the risk of inflation and the possibility of central bank intervention. The decline in retail sales may indicate that a recession is imminent.
When will the data be released: on the 13th of each month.
16. Trade balance
This is the difference between the country’s export volume and its import volume. When the value of exports far exceeds the value of imports, it is a trade surplus. Conversely, when the value of imports is significantly higher than the value of exports, a trade deficit will occur.
Why it deserves attention: The report shows the lagging indicators of the national economy. In addition, countries with severe trade deficits may accumulate large amounts of debt, which may cause their currencies to depreciate.
When will the data be released: on the 19th of each month.
17. Unemployment rate
The data shows the number of unemployed people nationwide last month. The index itself is calculated by dividing the number of unemployed by the total number of citizens capable of employment (excluding retirees, children, etc.).
Why it is worth paying attention to The lagging indicator that triggers the “domino effect”. The unemployed may reduce spending, that is, the amount of money that enters the country. This ratio may lead to a decline in GDP and increase the likelihood of an economic recession. The reverse is also true: low unemployment can be seen as a sign of economic growth.
When will the data be released: On the first Thursday of each month, it will be released at the same time as the NFP data.
Access to Exness’s Trading Central
Technical Analysis
There is no doubt that you must want to know the trend of asset prices. Well, the answer can be found in the real-time chart.
First of all, even a novice trader will start to focus on the trading platform to find the rules. The strange thing is that they do exist. Any graph is like a language for communication among mathematicians. A professor in any country can easily calculate the parabolic image and general formula.
The same is true for traders and analysts around the world. Based on these strategies, they have developed their own language to “recognize” trading signals and trade.
The main technical analysis tool is called an index: multiple lines (one, two, or more lines are used at the same time), these lines are superimposed on the price chart or appear below the price chart.
The indicator marks the direction of the mainstream trend, while the swing indicator signals the pivot point. Their principle is based on a formula that can automatically calculate and display the results in a visual mode.
People believe that referring to the performance of multiple indicators at the same time can clearly understand the market situation and help predict future price trends.
Similarly, there are two types of technical indicators:
- Trend (slow)
- Swing indicators (advanced)
The former category is usually used to confirm the existence of a price trend and give a signal after the actual turning point.
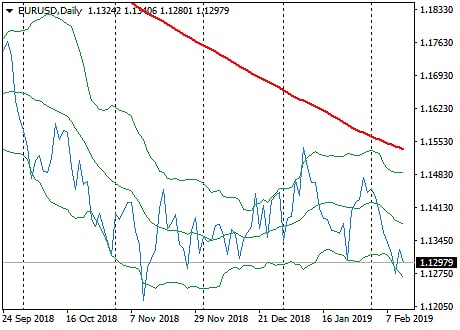
The development of swing indicators is to signal trend changes in advance. They measure the strength of the current price trend and point out that:
- the momentum of growth/decline has not been exhausted;
- there may be further corrections (unavoidable price reversals).
3 Golden Technical Analysis Patterns
Trend Lines
The trend line is the basic indicator of technical analysis. Its main purpose is to determine (and emphasize) the current price direction.
To place the indicator on the chart, you need to determine at least two highest points and two lowest points, and then use the trend line tool to connect them on the FxPro platform.
If the highs and lows of the price chart are gradually rising, it can be determined that it is an uptrend. When the price falls below the previous low, it can be considered a trend reversal.
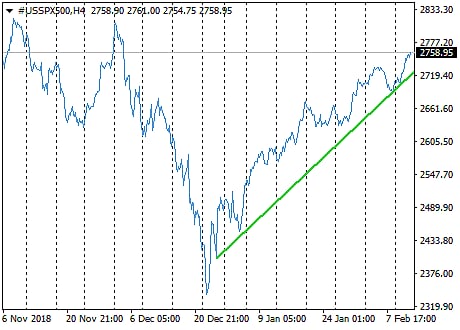
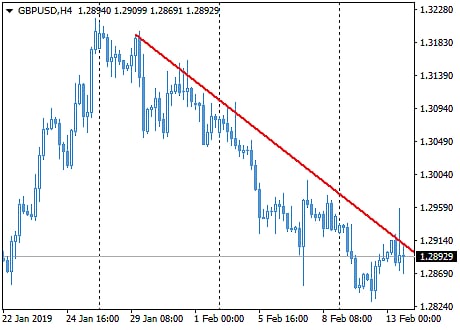
The downward trend is considered to be the high point of constantly reducing, low continually rising.
If the high and low are roughly at the same level, it can be determined to be sideways.
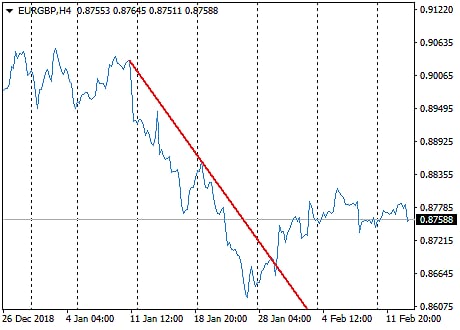
Trend lines can help traders identify pivot points where prices are more likely to rise (1) or where prices are more likely to fall (2).
Remember, the more evidence you see indicating an upward (downward) direction, the stronger the trend. Breaking a strong trend is harder than breaking a trend that has just started.
What is the Most Profitable Strategy?
Support and Resistance
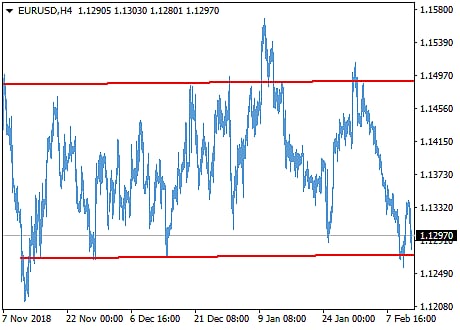
Look here, we have drawn two horizontal lines on the chart. Unlike trend lines, support (below) and resistance (up) are always horizontal.
To draw these lines yourself, you need to identify a few points that often stop prices.
The chart on the right shows that the resistance level is above the price channel and the support level is below it.
Note that all of these apply only to upward trends. For a downtrend, the opposite is true: the resistance level -the lower line, and the support level -the upper line.
Once the price breaks through one of the horizontal lines, this may be a strong signal for further decline or rise.
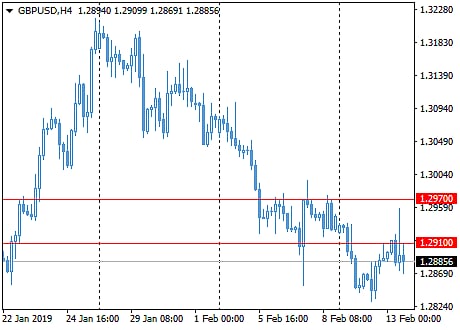
Sometimes it is impossible to establish a clear support/resistance level: then it is better to determine the range.
You can draw support and resistance levels through the entity or shadow of candles on the FxPro trading platform.
How to trade Forex with Trend Lines?
How to use support and resistance levels?
As seen in (a), (b), and (c) may be created to buy a good price point of order; (d), (e), and (f) the implementation of selling a good opportunity to order.
Of course, signals of support and resistance levels are not enough. You need to use some technical indicators to firm up your decision.
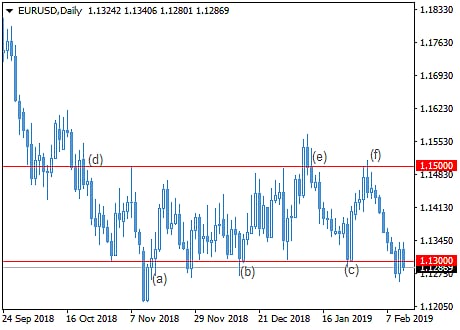
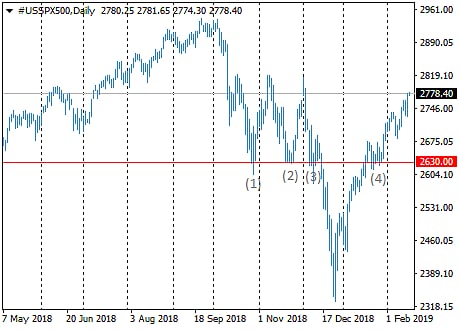
Note that the support level may become the resistance level in the future, and vice versa, depending on whether the price of the asset is rising or falling.
As you can see in the figure, the asset price tested the resistance level twice (point 1 and point 2). After breaking the range limit, the resistance level became the support level (point 3 and point 4).
What is Trend Trading and How to do it to make profits?
How to judge support/resistance levels?
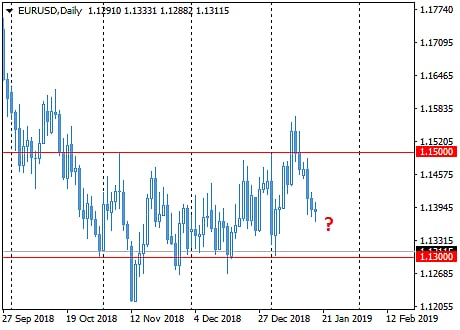
How to judge whether the asset chart is simply testing support/resistance levels, or will it breakthrough and go further?
It is believed that the more the price chart hits this level and then pulls back (tests it), the stronger the range and the harder it is for the price to break through. It is not recommended to trade in this range (the price is between the support and resistance levels) because it is difficult to predict further movements.
Forex Chart Types, Market Trends and Technical Analysis
When is the best time to use trend lines?
After the price starts to move from one level to another, when the first new candle is formed from the boundary of the price range, it is the best time to create a position.
In this case, the order should be closed before the price touches another line, because the price may not reach it at all.
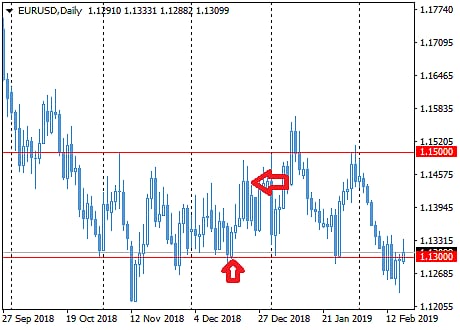
If the price exceeds the support level, you need to wait for 1-2 candles to appear and confirm the breakout, and then you can create an order in the same direction.
Consider that in this case, the support level will become the resistance level.
These descriptions are only examples, not as a guide for your operation.
When is the Best Hour for Forex and CFD trading?
Where is a better stop loss?
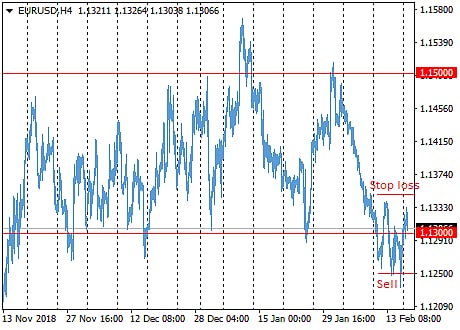
For example, if we created order at a price 5 points below the support level, it is reasonable to place the stop loss at the same position above the level.
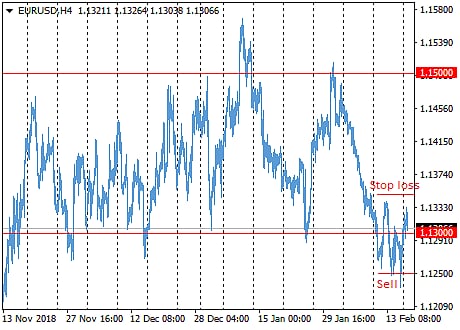
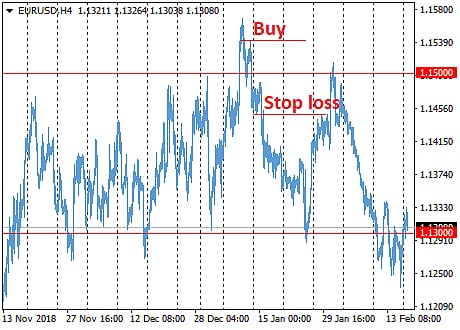
Similarly, if the asset price overcomes the resistance level, you can create a transaction, for example, place an order at a price 5 points above that level, then the stop loss can be set to 5 points below that level.
What are Stop Loss and Take Profit?
Forex Channel Trading
In technical analysis, the channel is another tool to determine the timing of the transaction, which mainly appears on the chart through the trend line.
It is mainly the area between two parallel lines in an up/downtrend.
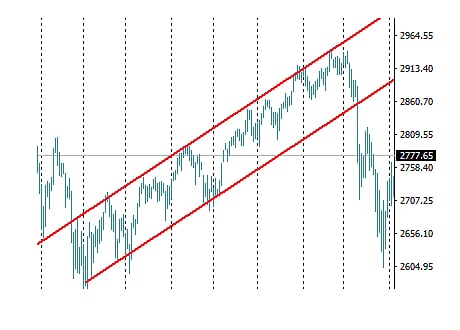
There are three types of channels.
The high points of the ascending channel continue to rise, and the lows continue to rise.
Down channel of the high points continue to lower, low also continue to decrease.
Lateral channel: each high and low point is at the same level as the previous point.
MT4 Basic – Market Watch, Price Chart and Opening trade positions
Types of Charts
You may be surprised, but price charts usually show certain shapes, which are called chart models (or graphs ).
At first glance, it seems quite difficult to find such a graph in a real-time chart. However, with practice, you will learn to determine the graph currently being formed and make trading decisions based on this information.
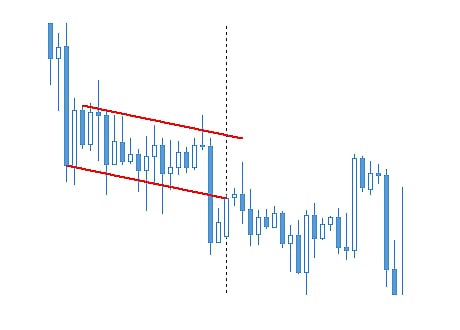
There are two main types of chart models: continuation patterns and reversal patterns.
As you might have guessed, a continuous pattern indicates that the asset price will soon move in the same direction.
A reversal pattern is just the opposite, indicating that the price will change direction.
3 Forex Trading Rules/Strategies to profit more everyday
Let’s take a look at the most popular graphical models.
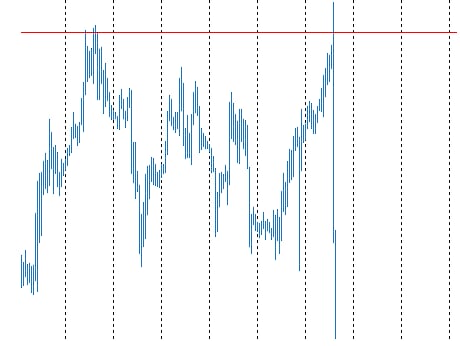
1. Double top
is a reversal pattern. Consider that the asset chart is trying to continue rising, reaching the imaginary resistance line twice, but moving away from the resistance line twice. After such adjustments, we believe that it has formed a downward trend more.
The double top is similar to the letter “M”. When a trader sees the formation of a double top on the chart, he will try to create a sell order after the second downward rebound to form 1 or 2 candles.
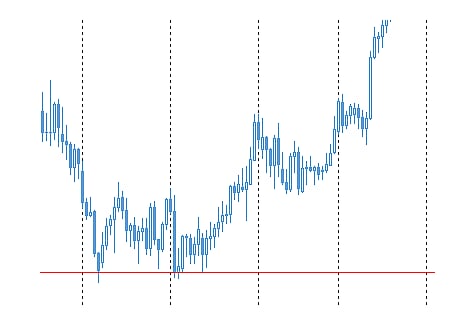
2. Double bottom
The double bottom is similar to the letter “W” and is formed after a long period of decline. Compared with the double-top model, the double-bottom model shows that after a second collision with resistance, a reversal occurs.
After the second attempt fails, traders usually create a buy transaction after forming 1 to 2 candles.
3. Head-and-shoulders pattern
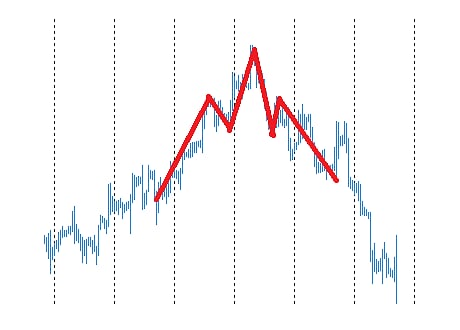
This is the most common graphical model, usually formed in an uptrend.
The graph contains the first price peak (this is the left shoulder ), followed by a higher peak (this is the head) and a lower peak (right-click).
Such a pattern indicates that after the formation of the right shoulder, the price may rebound and enter a downtrend.
Pay attention to the neckline: this is the support level pushed by the price. When the chart from the top in the end section through the neckline, traders can decide what price should be created in sell transactions.
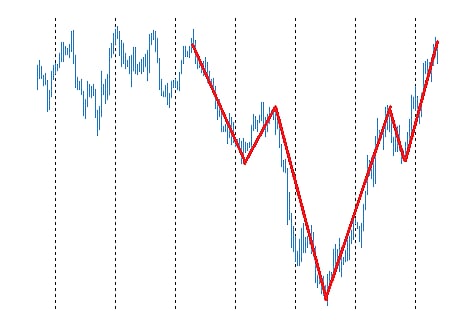
4. Inverted “head and shoulders” pattern
This is a mirror image of the previous form. In this case, the neckline is the guiding principle for creating buy transactions. It is necessary to observe the chart figures and wait patiently for the candle to cross this line.
Until then, this is not recommended: the chart may suddenly reverse, indicating that you are wrong.
5. Rising wedge
The model of rising wedge indicates that the current trend has stopped and that the market is in a period of indecision. Subsequently, the trend may continue, reversing in the opposite direction.
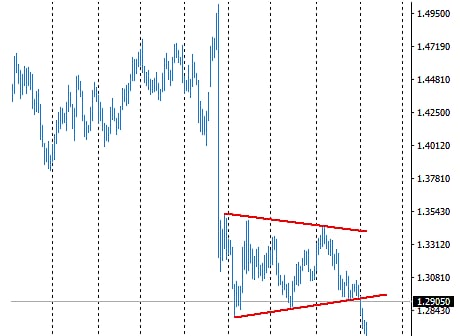
If it is an ascending wedge that appears in a downtrend, it is a continuation model. As shown in the chart on the right, this is because the price broke through the resistance line and continued to fall.
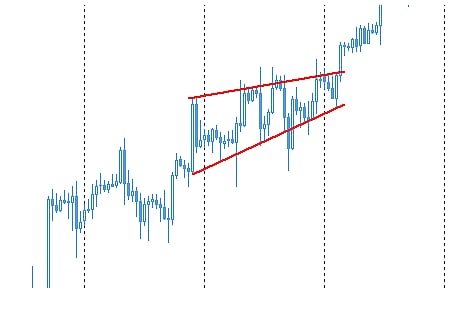
However, if an upward wedge appears in an uptrend, it is a reversal model because the price reaches the resistance line and starts to fall back.
6. Falling wedge
A falling wedge can also be seen as a signal of a trend reversal or continuation.
Unlike the rising wedge, the falling wedge generally occurs before the price rises further.
A falling wedge in a downward trend indicates an upward reversal.
The reverse is also true: in an uptrend, it can determine the direction of price movement.


 Deriv
Deriv  AdroFX