MACD does not have an advantage in promoting entry timing because of its relatively obvious lag. And when it encounters the less commonly used CCI indicators, what spark will these two oscillators with different usages collide with?
In day trading, the MACD indicator is mostly not used alone, usually, it is used in conjunction with trend indicators such as moving averages. The MACD indicator and another oscillator can also form an intraday trading strategy: MACD+CCI.
I will not repeat the basic usage of the MACD indicator, please refer to the previous content.
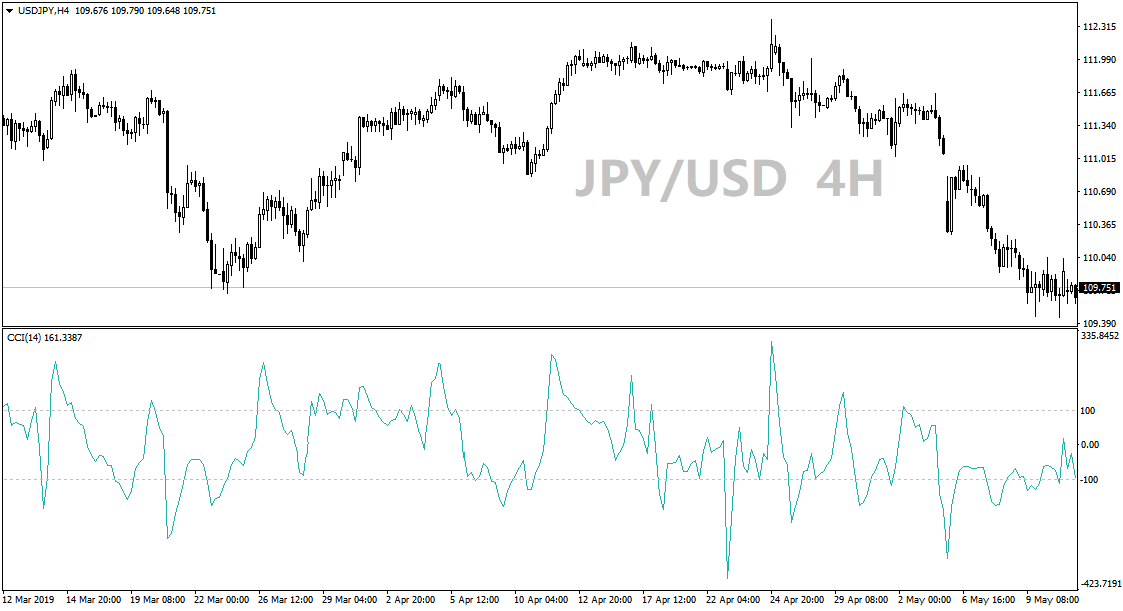
The CCI indicator, it is not commonly used in foreign exchange transactions. Like the RSI indicator and the stochastic indicator, the CCI indicator can also prompt overbought and oversold signals, but it has an invalid area, so it is inconvenient to use.

The CCI indicator on ONADA MT4 is between 100 and positive infinity, indicating an overbought signal, while negative infinity to -100 indicates an oversold signal, but between -100 and 100, it is not too big. significance. Observation shows that the CCI indicator is very sensitive. The CCI indicator was still moving above 100 at the last moment, and the next moment it may turn down and fall to 100, which will make the overbought signal instantaneously invalid. Therefore, I do not recommend using the CCI indicator as a Overbought and oversold signal alerts.
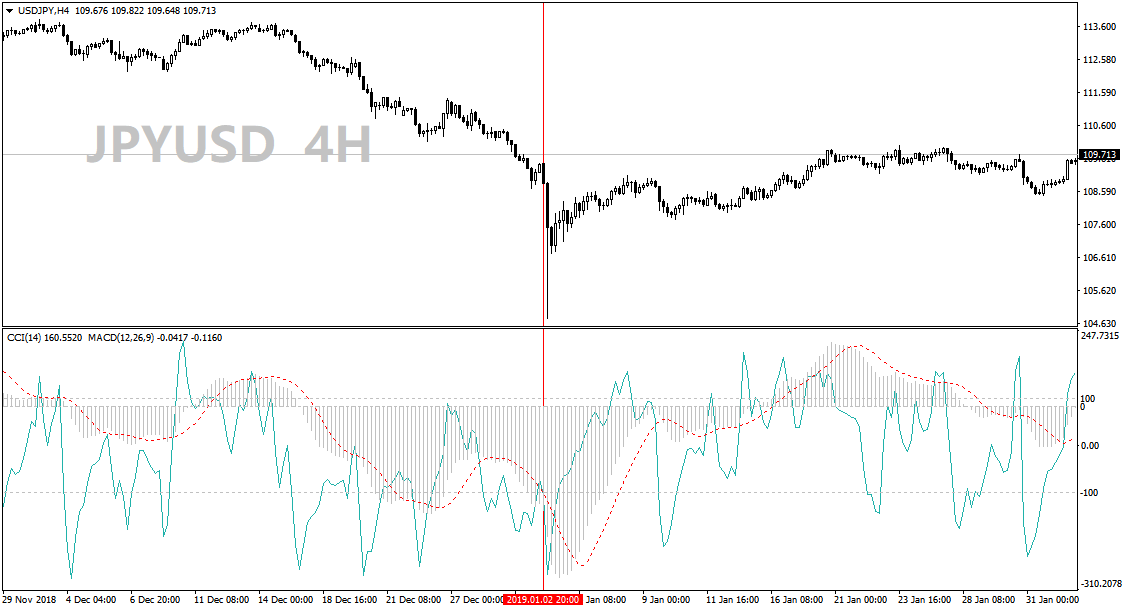
In the MACD+CCI strategy, we slightly change the way the CCI indicator is used, so that it can avoid its own shortcomings and make up for the shortcomings of MACD. The author found through observation that the CCI indicator will enter the overbought zone when the short-term bullish sentiment on the disk increases. When the short-term short sentiment increases, it will enter the oversold zone. So try to capture the timing of the CCI indicator entering the oversold and oversold zone After cooperating with the K line to take up). At this time, the MACD indicator acts as a reminder of long and short directions.
Then, for the MACD+CCI strategy, the basic rules are:
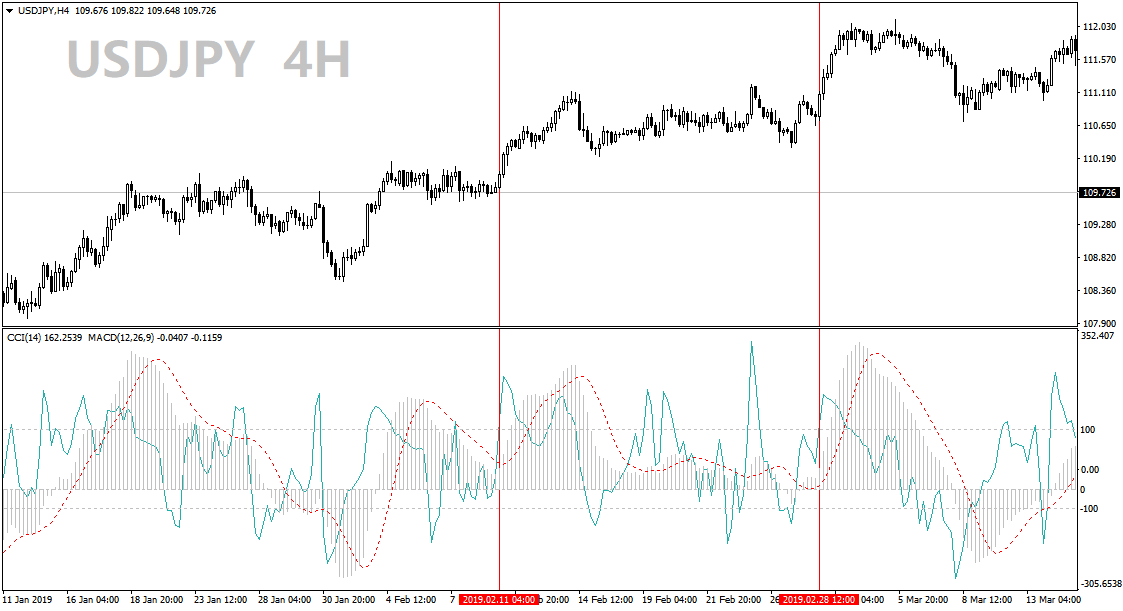
- The MACD indicator is above the zero line, and the MACD column is expanding, waiting for the CCI indicator to cross over 100, and the K line to close the Yang line, you can enter more orders. After MACD has a dead cross or comes below the zero line, more orders will appear.
- The MACD indicator is below the zero line, and the MACD column is extending. Waiting for the CCI indicator to cross below -100, and the K line to close the negative line, you can enter a short order. After the MACD crossed or came above the zero line, the empty order came out.


After and during the use of this strategy may be in a long or short opportunities arise, consecutive same Admission reminder, you decide whether you want to increase the position according to your own situation. At the same time, please also note that the MACD indicator can serve as a directional reminder for a short time, but it does not indicate a trend. Therefore, when considering adding a position, it is necessary to judge the megatrend in other ways. This strategy is suitable for intraday short-term trading, but it is recommended to observe the trend direction through multiple time frames in advance, and mainly trade in the direction of the trend.
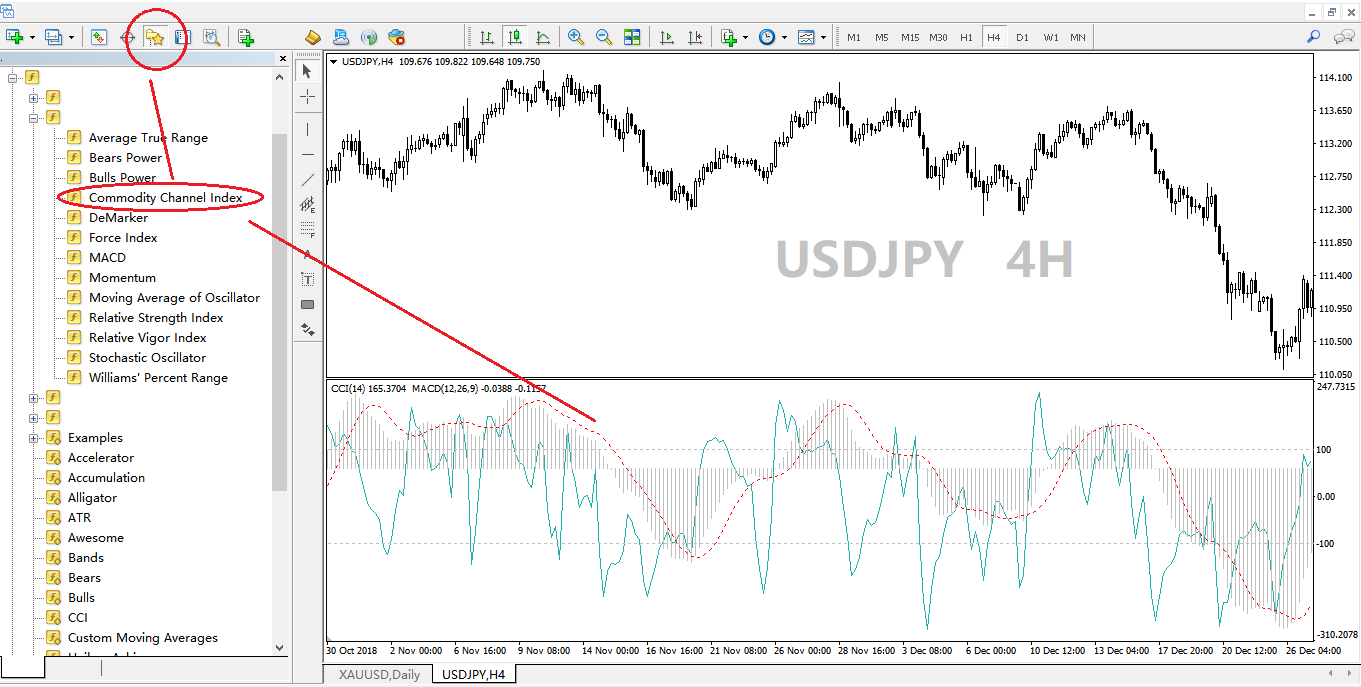
Finally, regarding the compound addition of MACD and CCI indicators, I will briefly explain this here. First, add MACD (default parameters) directly, and then use the “Navigation” icon in the toolbar (shortcut key is Ctrl+N) to pop up the sidebar, and then find “Technical Indicators”-“Oscillation Indicators”-“Commodity Channel Index” ( That is, the CCI indicator), and then drag the CCI indicator to the MACD indicator window (select the mouse without releasing the left button). The CCI indicator also uses default parameters.


 Deriv
Deriv  AdroFX