RSI indicator, an indicator that can associate the principle from the “tug-of-war” and calculate the characteristics. As one of the oscillating indicators, the RSI indicator can also reflect the overbought and oversold status of the disk, but it may be better to remind the long and short forces who dominate. Of course, because it is a single line in the default state, it may indicate that the entry may be unstable, but it can also be regarded as a simple and practical indicator.
What is RSI (Relative Strength Index)?
The RSI indicator, short for relative strength index, means “relative strength index”, and is one of the commonly used oscillatory indicators. From the point of view of the name, we should know that this indicator will definitely involve the comparison of the strength of the long and short on the board. Only when there is a contrast, there is a difference between strength and weakness!
To understand it simply, it is like a tug-of-war game with 100 people. It is assumed that everyone’s strength is equal. Then when the 50/50 is evenly distributed on both ends of the rope, the game will be stalemate and difficult to distinguish, but as long as one end is less If you drop one person and join the other end to form a 49/51 comparison, then you can divide the winners and losers. When it comes to trading, as long as there are more bullish people than bearish people, the disk is more likely to rise, and vice versa, the disk is easier to fall. This is also the basic principle of the RSI indicator.
Therefore, the RSI indicator has a long and short watershed, that is, above 50. 50 is a long area, and below 50 is a short area. According to the location of the RSI indicator, we can know that the disk is too long and short. And then assist trend judgment.
Note that when the RSI indicator is added for the first time on MT4, the 50 position is not prompted by default, and you can add it yourself.

Here, RSI indicators suggesting that bearish on the high side of kinetic energy, does not suggest the trend, after all, this is still a shock indicator.
Let me talk about the parameter first. The author directly uses the default parameter, namely RSI (14), which is purely considered from the perspective of kinetic energy. A slightly smaller parameter has a weaker hysteresis. Of course, the parameter cannot be too small. If it is too small The stability is not enough, so RSI (14) may be appropriate. (If you have a choice that is more suitable for you, please modify it).
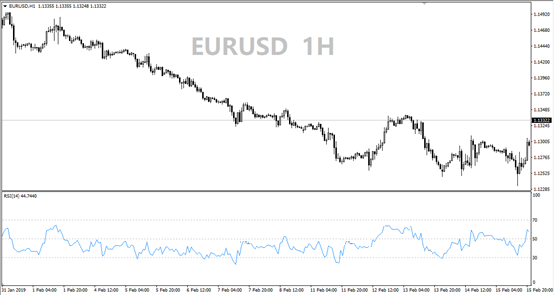
As can be seen from Figure 1 above, in addition to the 50 position that needs to be added for the first time, the 30 and 70 positions are also prompted. These two positions further divide the RSI indicator. 50 divides the long area and the short area, 30 divides the short area oversold area (0-30), and 70 divides the long area overbought area (70-100). Once the RSI indicator enters the overbought zone or the oversold zone, you should pay attention to whether the disk will soon usher in a retracement correction.

Obviously, RSI indicators are as overbought and oversold indicators to use, but I do not like to use it. After careful observation, the RSI indicator prompts that the disk is overbought and oversold, but it is easy to not enter the overbought and oversold zone, that is to say, it has to be a relatively heavy overbought and oversold to give a hint. It means that we can’t find the opportunity to enter the market through its overbought and oversold tips, and it is more appropriate to use it as an appearance.
As an indicator, the observation of morphology is essential. The lack of stability of the RSI indicator can be seen from the way it moves up and down, so more often the position of the indicator is more important, but there is still something to be said in terms of form.
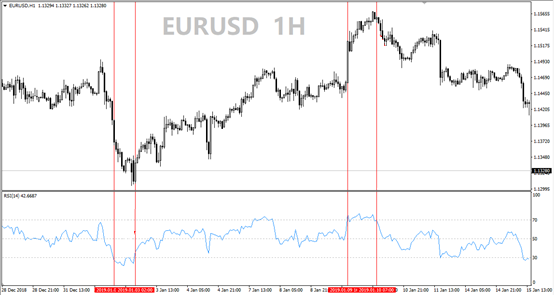
When the RSI indicator generally points upward, it is often accompanied by the K line. When it is still below 50, the disk may be in a rebound stage. After the indicator climbs to 50, the disk is too large and it is easier to confirm the bullish trend.
When the overall RSI indicator points downwards, it usually goes down with the K-line. When it is above 50, the disk may be in a retracement stage. After the indicator falls below 50, the disk is empty and it is easier to confirm the short trend.
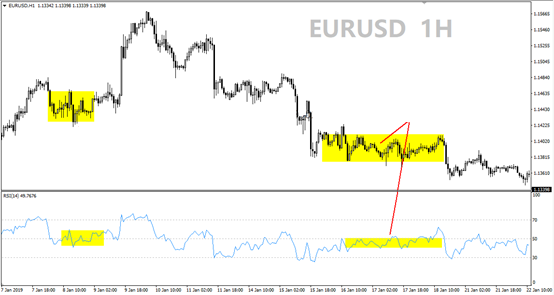
When the RSI indicator tends to point toward the level, it is usually accompanied by K-line consolidation, but its position reminds us of its more likely direction of breakthrough. For example, if the level is above 50, the disk is too much, and it is easier to break upward, and vice versa. But when it fluctuates in a narrow range around 50, it is truly a stalemate between longs and shorts.

So, when we consider more than a single admission, usually to take advantage of the RSI above 50, and pointing upwards. The same is true when looking for short opportunities.
Having said that, I don’t know if you can see that it is actually very troublesome to find a clear entry signal through the RSI indicator. As an oscillator, the lack of stability is too obvious, and it is difficult to make up for it with a trend indicator. Therefore, in the title, the author pointed out that the RSI indicator is best if it is long and short. At most, add the “find a market opportunity” article.
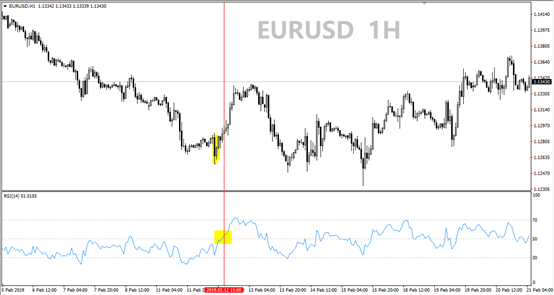
Regarding the RSI indicator to find market opportunities, in addition to overbought and oversold, the 50 levels can also be considered. The indicator goes from above 50 to below 50, which means that the disk has turned to bear the advantage in kinetic energy, and the disk will deepen the retracement and may even form a short trend. Short-term long orders may not be too late at this time.

The chart finally add that we may see the use of 3 RSI indicators in the stock trading software, but to be honest, 3 RSI indicators on the foreign exchange market to use it, it The hysteresis can not offset the shortcomings of insufficient stability.


 Deriv
Deriv  AdroFX