Strategies for using the ADX indicator
The ADX indicator is the acronym for the Average Directional Index. Many friends may not have seen this indicator. But it is indeed an indicator that exists by default in the MT4 platform, but MT4 processed it and named it Average Directional Movement Index, also known as ADMI.
What is ADX (Average Directional Movement Index)?
It appears in the chart shown below.
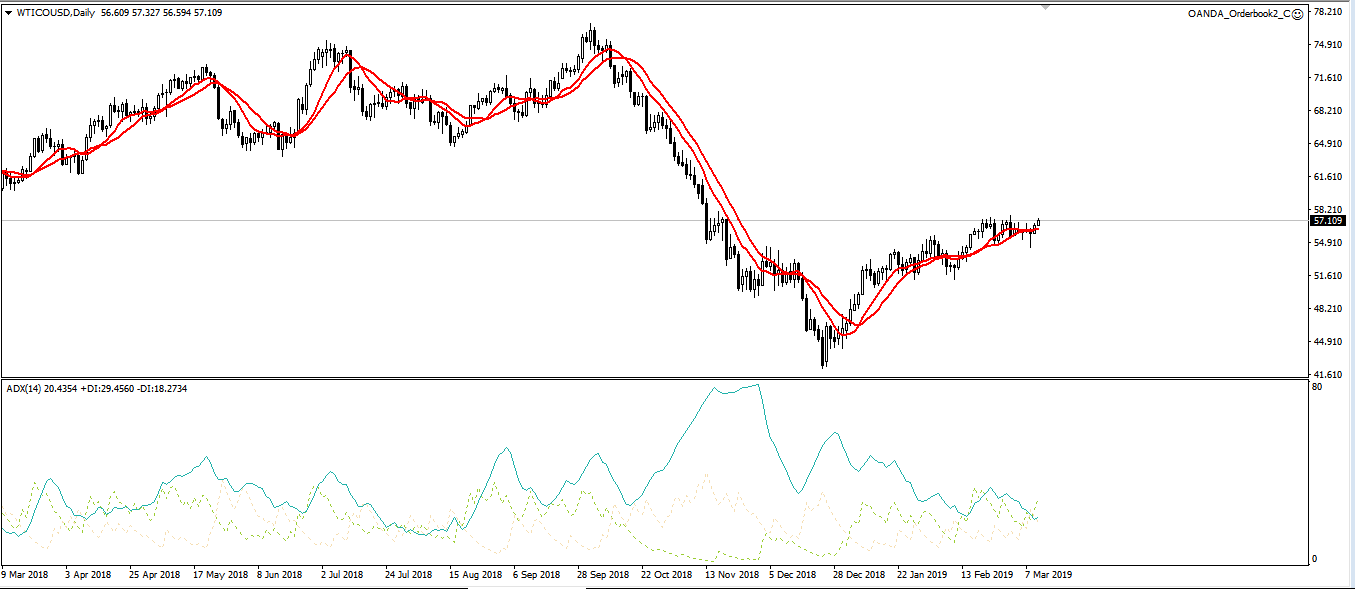
The index is composed of three lines, these three lines are ADX indicator (the thickest red line), +DI (red thin line) and -DI (blue thin line). For the convenience of observation, we will change the dotted line in the figure to the solid line below, and at the same time change the thick blue line to a red line.

Like the well-known RSI indicators, the ADX indicator was also invented by the American master of technical analysis Welles Wilder. At that time, there were many technical indicators in the market, both trend indicators and shock indicators, but the market applied to each indicator was completely different. The former is suitable for the unilateral trend market, while the latter is suitable for the shock market. The question is, how to judge the trend market or the shock market? Wilder thought, could he invent an indicator to determine whether the current market is a trend or a unilateral market? Thus, the ADX indicator came into being.
By observing the trend of the ADX indicator and price in the figure below, we can find that the ADX indicator and the price often diverge, and there is no clear relationship: sometimes the price rises and the ADX also rises. Sometimes prices fall, ADX rises.

ADX distinguishes between consolidation and market situation. The reason for this is that ADX is not used to judge price direction, but to judge volatility. The original intention of Wilder inventing this indicator was to use volatility to determine whether there is a trend in prices: If the volatility of the price in a certain direction is high, then there is a trend in the price at this time. Conversely, if the volatility is very low, there is no trend at this time. If we add a 25 red line to the ADX indicator in the above figure, we can see two rules from here :
1. When ADX is below 25, the price is often in a relatively obvious consolidation area, that is, at this time there is no clear trending market. At this time, you should avoid using a trending trading system. For example, there are three moving averages in the three positions of ABC in the figure below. When A and B appeared twice, ADX was below 25, and these two dead forks were later proved to be fake dead forks. But when C appeared, ADX was already in a very high position, and then this deadlock brought a big downturn.
2. When the price appears more violent unilateral market (whether it is a unilateral rise or a unilateral decline), the ADX indicator will rise rapidly. The rapid rise of ADX shows that there is a relatively clear unilateral price in the price at this time, and the trend strategy at this time is more applicable.

3. ADX can also help us answer a question about whether we should chase the rise or fall. Many investors often have this question after seeing a sharp rise or fall in prices: I have fallen so much, can I still go short? It has risen so much, can I do more? Then ADX can answer this question.
If we add another special value of 45 to the figure, then we will see another situation:
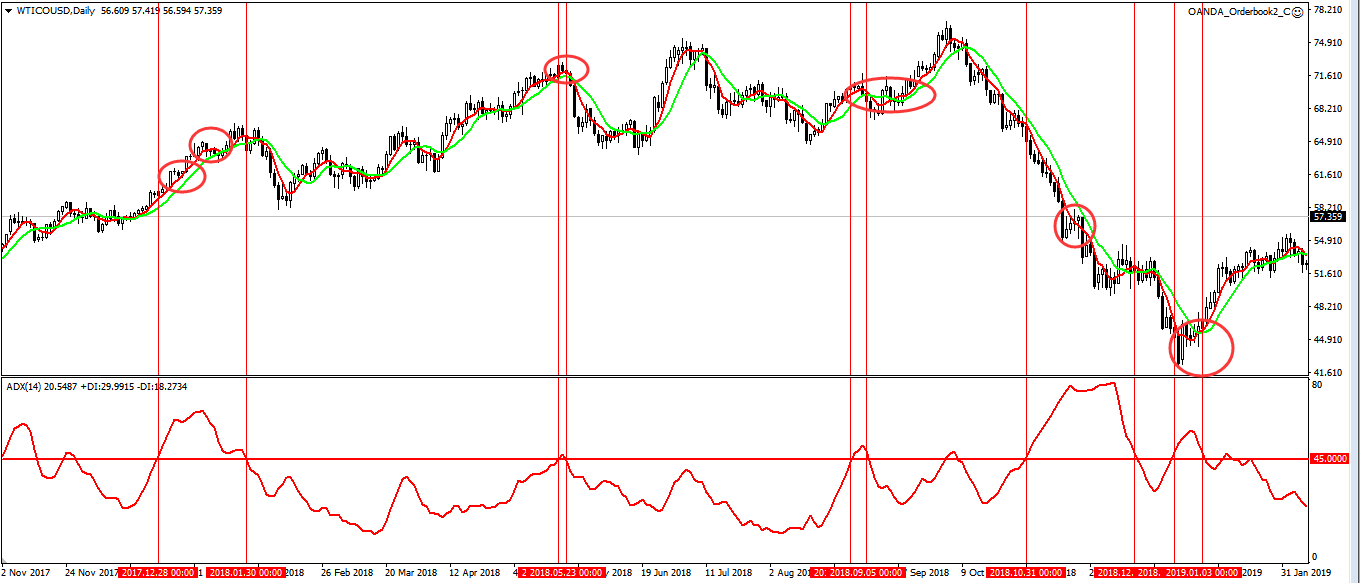
In the above chart, in addition to the penultimate ellipse area, we can see that when ADX reaches above 45, the price will often enter a period of consolidation soon, or even a trend reversal. At this time, it is very uneconomical to catch up and kill down. However, please note that what is said here is only to chase the rise and kill the fall is not cost-effective, and is not to encourage backhand to go short or go long. Because the price may continue to move in the original direction after a period of consolidation.
How to judge the direction of the trend?
Next, we discuss the use of ADMI, which is to add back the two thin lines deleted earlier. As mentioned earlier, when ADX is above 25, it indicates that the price is trending. Otherwise, there is no trend. When ADX breaks through 25 from bottom to top, it indicates that the price may usher in a round of trend or a round of unilateral market. So is this trend an uptrend or a downtrend?

The answer to this question depends on the location of the + DI and -DI is located. +DI aims to measure the momentum of price increases, while -DI measures the momentum of price declines. If when ADX breaks above 25, +DI is above -DI, it indicates that the current bulls are dominant and the new trend may be an uptrend. Conversely, when +DI is below -DI, it indicates that bears are dominant, and the new trend may be a downward trend.
For example, in the figure, A\B\C\D\E crosses 21 o’clock five times and +DI is above -DI, which implies that an upward trend will occur. Among them, with the exception of B, the other four times have seen a considerable rebound trend. When F appeared, -DI was above +DI, indicating a short-term trend, and then the price showed a relatively violent unilateral decline.
The choice of critical value
Of course, in actual trading, we do not necessarily use 25 and 45 as the watershed for judging whether the trend exists and the trend is overstretched. 25 and 45 are a level recommended by Wilder. But in actual trading, investors can select this threshold based on the characteristics of different varieties and their own trading styles. Generally speaking, this threshold can be set between 21-25 or 45-50. The choice of this threshold will affect our trading results.
Generally speaking, the higher the critical value we choose (such as 25), the more false signals we eliminate, but this will also kill some true signals by mistake. In this case, the fewer risks we face, the fewer potential profits we can obtain, which is suitable for some conservative investors.
If we choose a lower threshold (such as 20), then we can seize more opportunities, but the probability of being misled by false signals is greater. At this time, the potential profit and potential drawdown of the account will be greater.

 Deriv
Deriv  AdroFX