How to start using OctaFX's Autochartist, a market scanning tool? Table of Contents
How to use OctaFX’s Autochartist?
The Autochartist market report provides a clear overview of the current trends in the most popular trading tools.
The report is sent to your inbox at the beginning of each trading session.
The report will suggest which trading tool you should choose next, or whether your current strategy needs adjustment.
In addition, it can significantly save time when analyzing charts.
Get Access to OctaFX’s Autochartist
Each market report consists of three main parts:
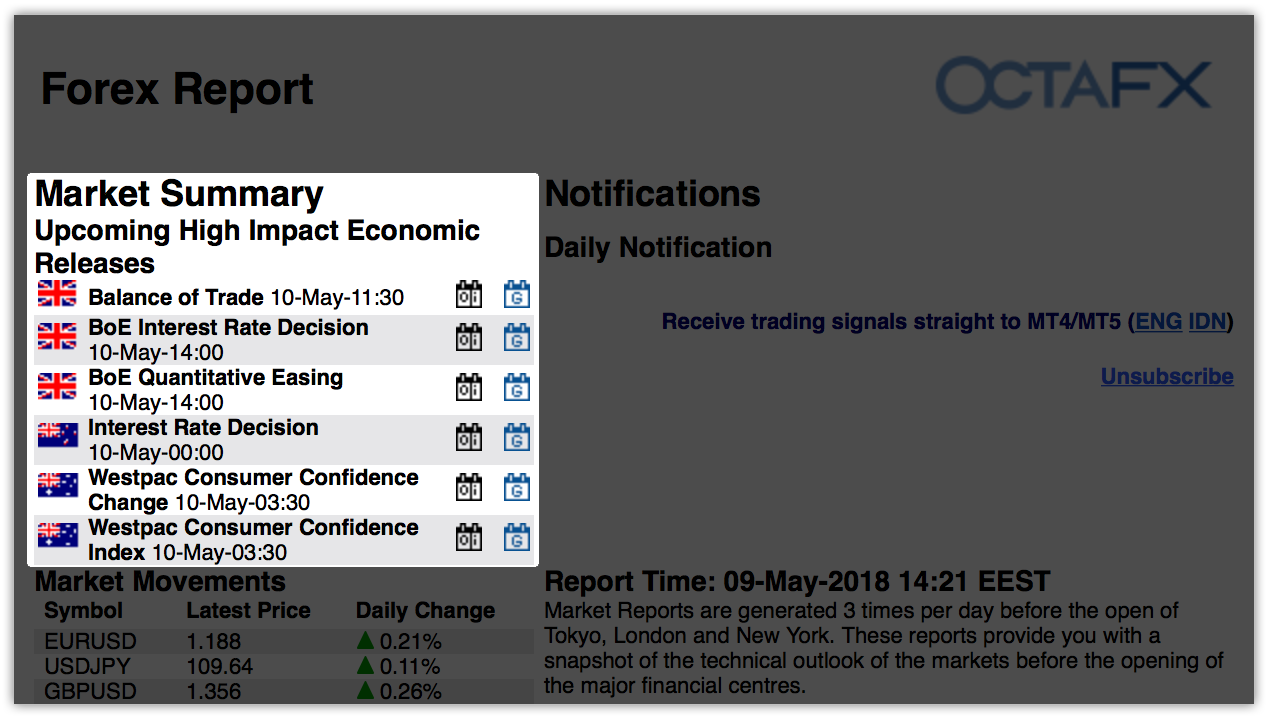
1. Upcoming financial news releases with significant impact
In the upper left corner, you will see a list of all news releases for a day.
These news reports are extremely important because they affect the market during major news releases, so risk management techniques are needed to reduce risk exposure.
2. Market volatility
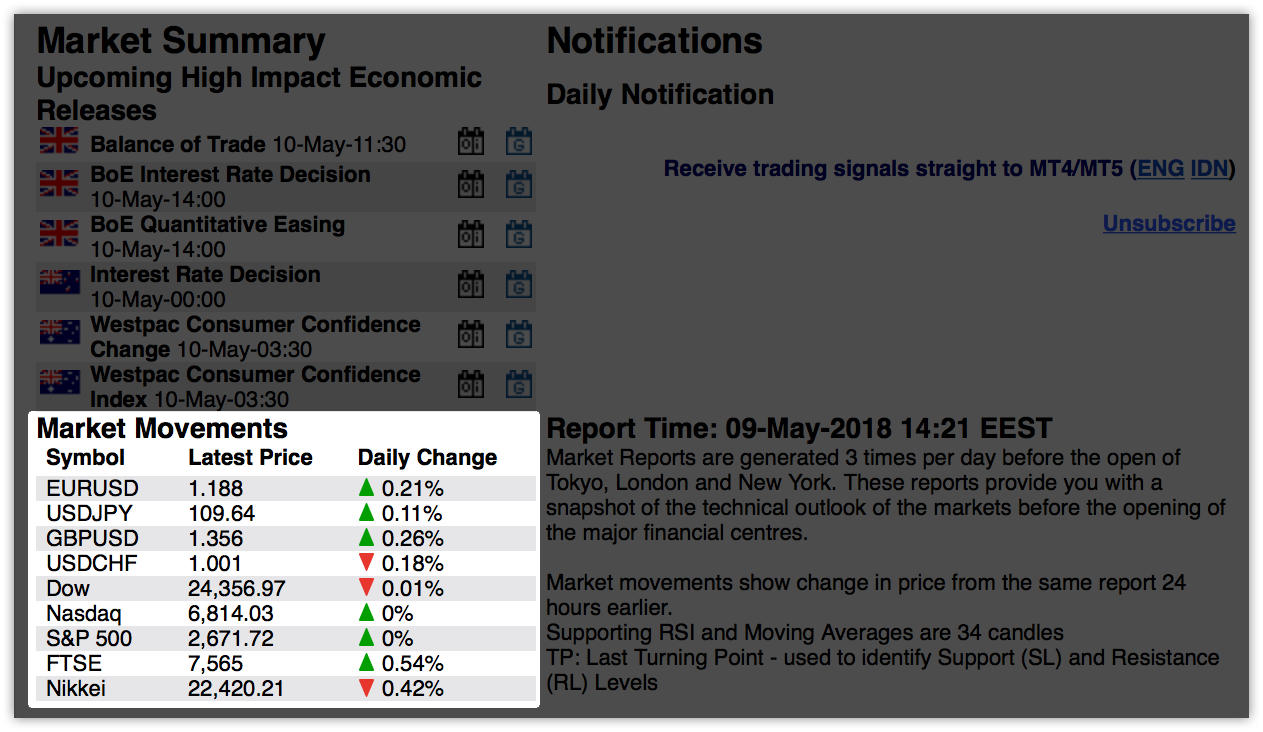
The market volatility section provides recent price charts of some trading products: it shows the direction and percentage of price changes in the past 24 hours.
The daily percentage change is highly correlated with news reports-prices may rise or fall or change their direction completely.
3. Trading Opportunities
The actual price forecast is just below the market volatility.
It contains information about the expected price, the time to reach the expected price, the breakdown of basic indicators, and the trend chart.
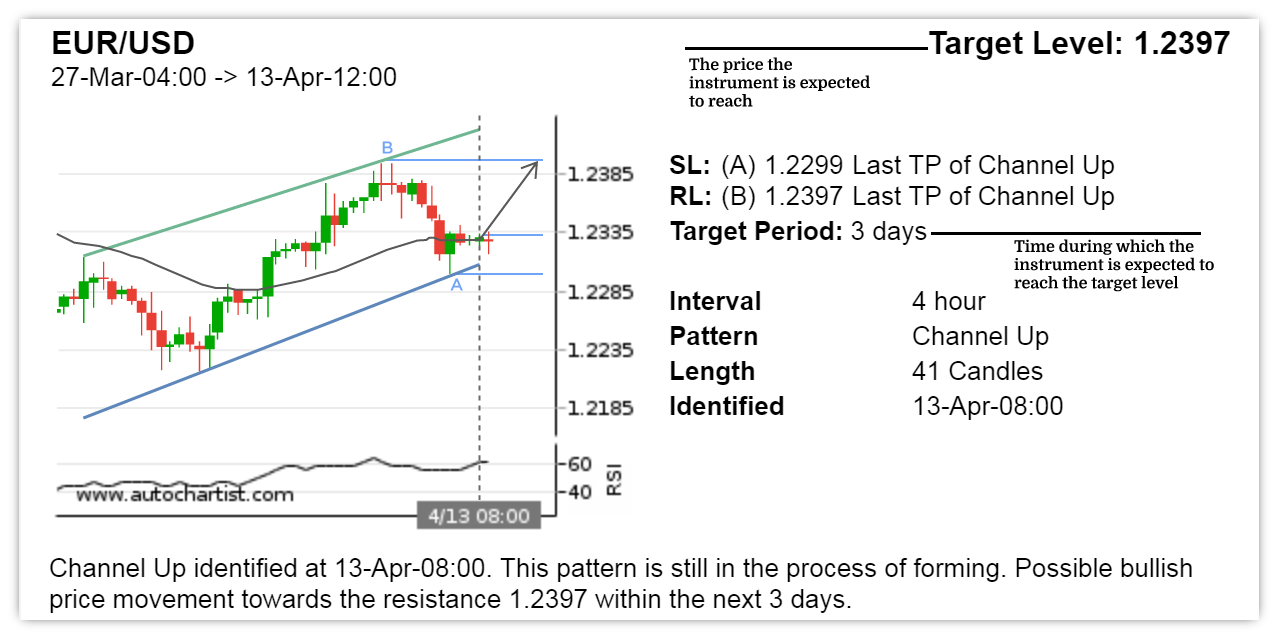
- SL
- support level
- RL
- resistance level
- Interval
- the periodic interval pattern of the chart appears
- Pattern
- the name of the mode on which the basic trading opportunity is based
- Length
- the number of candles on which the opportunity is based
- Identification
- the date and time when the pattern appeared
In this case, the current EURUSD price is 1.23350.
Within three days, its price is expected to reach 1.23970.
Seize this trading opportunity and open a long (buy) position on EURUSD, you can get a profit of about 62 points or $620.
Currently estimated to be as high as an 80% correct rate, the Autochartist market report is a simple tool for beginners, allowing you to apply technical analysis to support trading decisions, making your trading easier and less time-consuming.
OctaFX provides this information for free.
Just make sure you reach the silver level or higher.
How to use Autochartist?
Although technical analysis has proven to be one of the most reliable methods for making smart trading decisions, it can be time-consuming and often requires reference to multiple indicators and other tools. To simplify the chart analysis and ensure that OctaFX’s customers in the proportion of profitable trading better, OctaFX and chart pattern recognition tools Autochartist one of the leading suppliers cooperated.
The Autochartist Metatrader plugin sends real-time trading opportunities directly to your terminal. You can view chart patterns and trends with just one click. You can also receive daily market reports via email.
Get the Autochartist Metatrader plugin:
- Get a silver user status or make sure to keep $1,000 or more in your trading account. The fastest way is to recharge the account balance.
- Download the plugin.
- Follow OctaFX’s installation guide operation.
- Drag and drop the Expert Advisor plug-in onto one of your charts.
Sign up to get access to OctaFX’s Autochartist
How to trade using AutoChartist plugin?
The Expert Advisor plugin does not create any trades, it only displays the patterns recognized by Autochartist.
1. Find the currency or trading opportunity you are interested in. You can do this in multiple ways.
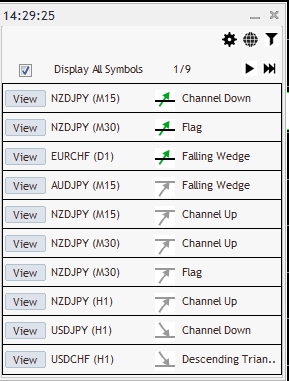
Click the left and right arrow buttons to browse all trading opportunities in the current market
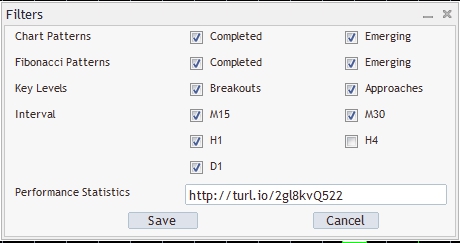
If you are interested in a specific time frame or pattern type, please use the “Filter” option to filter and view market trends. Here is a brief description of each filter:
- Completed chart pattern
- the pattern has been identified and the price has reached the target level.
- Emerging chart pattern
- the pattern has been determined, but the price has not yet reached the target level.
- Completed Fibonacci Pattern
- a trend chart formed when the price chart moves up and down at a specific price ratio.
- Emerging Fibonacci Pattern
- if the price reaches the level of the pink point and reverses, the pattern will be completed and the expected level of support or resistance will appear.
- Significant levels
- breaking through support-trading opportunities where the price breaks through the support level.
- Significant levels
- breakthrough resistance level-trading opportunities where the price breaks through the resistance level.
Uncheck Show all trading instruments and only view the patterns identified by the instrument with the open chart.
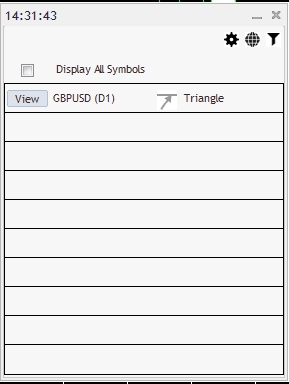
Click View to see each opportunity identified in the chart. Use the ” Pattern Details ” window to get more detailed information.
2. Use these predictions to help you decide the direction of the transaction. The general rule of thumb is that when prices expected to do more (to establish long), in anticipation of the price falling short.
The general rule of thumb is that when prices are expected to rise to do more (open buy orders) when the price is expected to fall short.
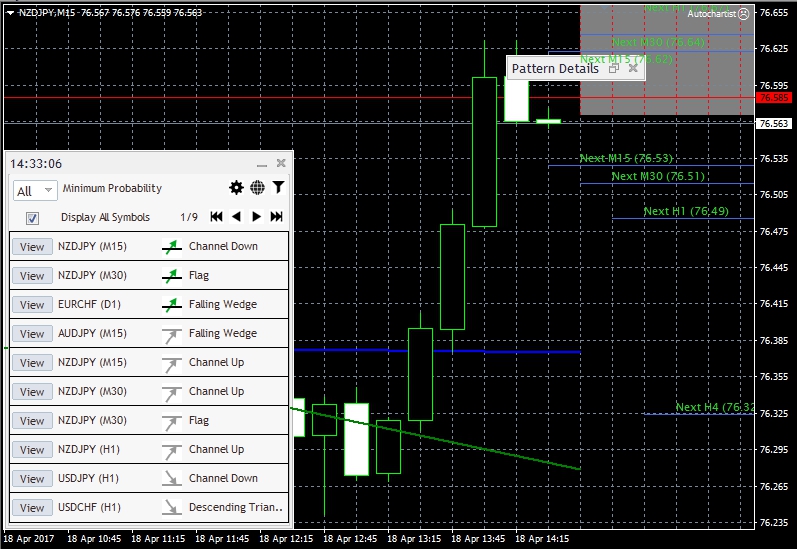
CHFJPY is expected to rise based on the triangle pattern.
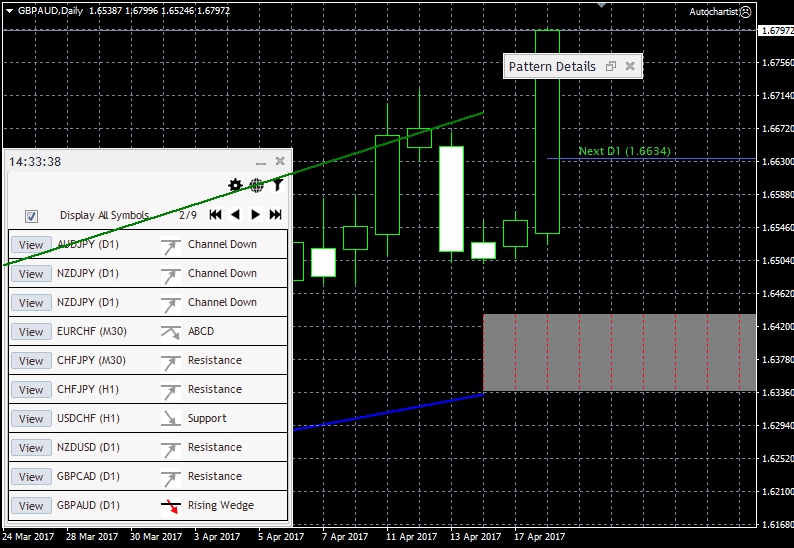
It is expected that EURCAD will fall based on the triangle pattern.
3. Press F9 to open the new order window or click “New Order”.
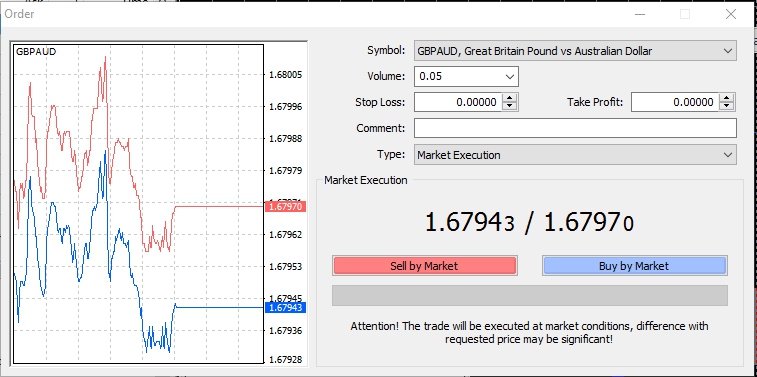
4. Make sure that the selected trading tool is what you want to trade, and set your trading volume in units of lots. The trading volume depends on the size of your funds, your leverage, and the risk-reward ratio you are pursuing.
5. Click to buy or sell according to the price trend.
6. It is recommended to set stop loss and take profit based on the level of volatility, but this step is optional.
Click View in the AutoChartist plugin to open the pattern you want to trade. Enable panning the right border of the chart on the toolbar.

The “Volatility Level” is displayed on the right side of the chart. Used to estimate the approximate range of price fluctuations.
If you want to make long (buy), you should set the stop loss below the opening price and set the take profit above the opening price. For shorting (selling), set the stop loss at a higher position and set the take profit at a lower position.
When selecting stop loss and take profit levels, please pay special attention to the lowest stop loss level. You can view the lowest stop-loss level by right-clicking on the trading product in the market quote and selecting specifications. From the perspective of risk management, it is recommended to maintain a risk-reward ratio of at least 1:2.
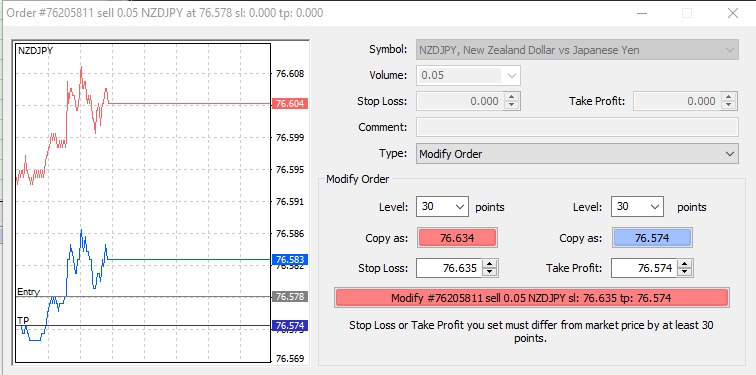
After determining the appropriate stop loss and profit, find your position in the trading tab. Right-click and select Modify or Delete Order.
Set stop loss and take profit, then click Modify to save the changes
The Autochartist plugin provides unique insights into market trends and saves you a lot of time. If you are interested in Autochartist and want to know more information, please contact OctaFX’s customer service department.
Please check OctaFX official website or contact the customer support with regard to the latest information and more accurate details.
OctaFX official website is here.
Please click "Introduction of OctaFX", if you want to know the details and the company information of OctaFX.


 IronFX

FXGT Broker Review: A Leader in High Leverage Forex and Cryptocurrency Trading
Comment by whatisgoingonTRUMP
February 17, 2025
Trump’s team holds 80% of the $TRUMP token supply, giving them the power to influence prices and put investors at risk. A crypto controlled by one group? Doesn’t seem very decen...