How to start trading Forex and CFDs on FXPro's platforms? Table of Contents
- What is FXPro's CFD?
- How to start trading Forex and CFDs with FXPro?
- What is the financial market?
- Who are the participants of financial markets?
- When you can invest in financial markets?
- Global Forex and Stock Exchanges Sessions
- How to trade in financial markets?
- Place orders on FXPro's Web Trader
- Base Currency and Counter Currency
- Difference between Bid and Ask prices
- Types of charts on FXPro MT4 and MT5 platforms
- The basis of point value
- What is the lot size?
What is FXPro’s CFD?
A contract for difference (CFD) is a popular financial instrument that allows you to profit by participating in the price movements of stocks, indices, futures and exchange-traded funds.
They allow you to open and close positions without actually acquiring assets (for example, you don’t have to be a shareholder, but you can predict that the stock price will rise or fall and buy and sell in the appropriate direction).
It should be noted that your profit and loss is determined by the difference between the opening price and the closing price.
find out more about CFD trading of FXPro
Advantages of CFD are:
1. No transaction fees
Since you do not own the assets (such as stocks) and do not assume any obligations, you do not need to pay additional fees. A CFD is a contract between you and FxPro.
2. “Short” position (sell)
To make a profit in such a transaction, you need to click the “Sell” button on the trading platform and wait for the asset price to fall. The more the price drops, the greater your profit. The opposite situation is: if you create a “short position” position, but the price rises, your trading income will start to become negative. At the same time, the price is always falling faster, so such holding period is always no more than a few hours.
You can make a profit in both “rising” and “falling” markets, but if you have a substantial asset, you can only make a profit when the price rises.
3. Ability to trade at any time
To establish a CFD position, the funds you need are substantially less than the funds required to purchase physical assets. However, it is worth noting that leveraged trading may bring profits and lead to losses.
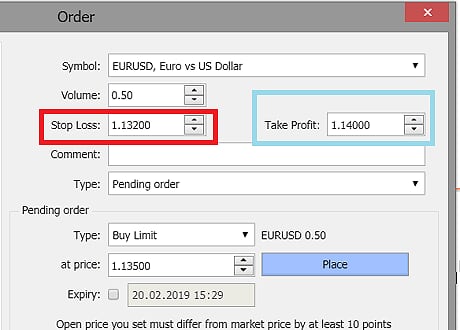
No matter what type of position you choose, you must set a stop loss and the price at which the transaction can be closed at a profit (take profit ). After setting, there is no need to sit in front of the monitor and watch price data changes all the time.
How to start trading Forex and CFDs with FXPro?
Here is a step-by-step guide to start trading CFDs with FXPro.
If you haven’t opened an account with FXPro yet, go to the registration page and open one today.
Step 1. Learn about the markets
Learn the trading rules of stocks, indices, metals, energy, futures, and cryptocurrencies.
Step 2: Choose asset type or product
To understand which product you want to trade, confirm that you understand the trading rules and conditions. Based on the’rules’ for each product, see the “Order Execution Policy’ on FxPro website for more details.
Step 3. Choose to Buy or Sell
If you think the price will rise, click “Buy”. If you think the price will go down, click “Sell”.
In addition, you can also set limit orders.
A limit order is a pending order that will be executed when the price of a financial instrument is higher than the current price. Therefore, if the price does not reach the limit price level, the order will not be executed.
You can set stop-loss, take-profit, and limit orders at any time, even after the order is created. The manipulation is quite convenient, especially if you choose to trade with one click.
Step 4. Determine the size of the transaction
A CFD is equal to a substantial share. When opening a position, you can specify the position you think is suitable (of course, it needs to be within the allowable range of margin).
Step 5. Set stop loss
This is an instruction to help lock in losses and manage trading risks. In fact, after setting the stop loss at a specific price level, if the price is not good for you and hits the stop-loss price, it will start to close the position.
Important: Stop loss does not guarantee that your position will be closed at the specified price. If the market fluctuates sharply, the closing price may have a certain slippage with the price you set.
Step 6. Observe
After placing an order, you will be able to observe the changes in the level of profit and loss in real-time. You can master these changes through the trading platform or by logging in to the mobile application.
However, it is not recommended that you always do this: the price of financial instruments is constantly changing, and your balance level will fluctuate accordingly.
The most important thing is the final result: don’t change your trading strategy, don’t be controlled by emotions. In this regard, trading psychology is very important (we also recommend that you study with us).
Step 7. Close the position
You can complete the transaction at any time by clicking the close button, or you can wait until the “Take Profit” price is triggered.
How to set: When doing long, the take profit price should be higher than the current price. If it is short, the take-profit price should be lower than the current price. Generally speaking, it should be set at a stop-loss price of 2 times the opening price.
After the order is closed, your net profit or loss will be immediately reflected in the trading account balance.
What is the financial market?
The price ( quotation ) of financial instruments changes every second, depending on the supply and demand of specific products around the world.
If there are many people in the market who want to buy an asset (currency, stock, metal), they press the buy button, and the demand will increase.
As soon as demand starts to grow, as buyers want to create a buying position, they will be willing to accept higher prices and prices will rise.
In addition, it also affects quotation changes…
- News:
- Any negative data in the country will cause the country’s currency to decline, while positive data is just the opposite and will lead to an increase.
- Central bank policy:
- Interest rate decision and statement of central bank representative.
- Corporate Reporting:
- Companies listed on the stock exchange regularly announce their financial performance. These numbers depend on whether investors will buy these securities or sell them quickly.
- Government data:
- Unemployment rate and inflation level, trade balance report, all fall into this category. The market not only pays close attention to these figures, but also pays attention to comments about any changes and the direction of monetary policy.
So to summarize “what financial market is”:
- The financial market is composed of buyers and sellers, who can conduct physical transactions on exchanges or use online platforms to conduct over-the-counter derivatives transactions by predicting price trends.
- Provide products including foreign exchange, spot precious metals, stocks & indices, futures and more.
- A trader buys profit when prices are rising, and sells profit when prices fall. If it is contrary to the forecast, the trader will incur a loss.
- Supply and demand factors affect price fluctuations, and market news, central bank policies, financial report releases, and macroeconomic data reports all affect it.
- Financial market participants include mainly central banks, governments, small banks, hedge funds and brokerage companies.
See available markets for trading on FXPro
Who are the participants of financial markets?
Let us see who are the market participants
- Major banks
- UBS, Deutsche Bank, JPMorgan Chase, Citibank and Goldman Sachs conduct a large number of foreign exchange and foreign exchange derivatives transactions every day. Its own needs are also in response to the requirements of customers (companies, governments, hedge funds, large private investors).
- Government and central
- Banks The main representatives of such banks are the European Central Bank, the US Federal Reserve System, the Bank of Japan and the Bank of England, which are responsible for managing the national currency exchange rate and controlling the presence of other banks in the market.
- Small banks, commercial banks, and hedge funds
- Small banks, commercial banks, and hedge funds are involved in the sale of products and exchange one physical currency for another physical currency (may also participate in speculative transactions).
- Brokers
- These are intermediaries between private traders and financial markets. Through the services of online CFD brokers, you can trade anytime, anywhere.
Join the Global Markets through FXPro
When you can invest in financial markets?
Each trading day in the financial market can be divided into several trading hours: the business hours of the world’s largest stock exchanges, which are opened according to time zones.
The trading day starts in the Pacific time, followed by the Asian time, then the London time, and finally the US time.
In a few hours where one time period overlaps another time period, the quotation changes extremely fast. Analysts said that this was “a period of increased volatility”.
- The financial market is divided into global trading hours, generally Asia, Europe and North America trading hours.
- The opening time of each exchange varies according to the time zone.
- With the opening of the Sydney Stock Exchange, a new trading week began, followed by Tokyo, London and New York. (Other smaller global exchanges also participate)
- When the main trading days overlap, there will usually be more price fluctuations due to increased speculation and news.
- When no trading hours are open during the weekend, there will be a gap in the price.
Trade anytime and anywhere with FXPro’s mobile app
Global Forex and Stock Exchanges Sessions
When the Sydney Stock Exchange opens every Monday, Tokyo is still early in the morning, London is still Sunday evening, and New York is still Sunday afternoon.
In the beginning, all asset quotes will react to events that happened last weekend. It is difficult to predict the current price trend, so it is strongly recommended not to hold positions on Saturday and Sunday. If you don’t want to experience unpredictable forced liquidation, it is best to close your open positions on Friday night.
During the Asian session, the first major news released that day, and the one that attracted the most attention was Japanese data.
The most active changes can be seen on the USD/JPY (U.S. Dollar to Japanese Yen), EUR/JPY (Euro to Japanese Yen), and AUD/JPY (Australian Dollar to Japanese Yen) charts.
After the London session opened, market volatility increased because its opening inherited the closing time of the Japanese session, and when it closed, the New York session began.
Economic data for the Eurozone, the United Kingdom and Switzerland will be released at this time. Any changes in these indicators will cause large price fluctuations. The affected currency pairs are EUR/USD (Euro to U.S. Dollar), GBP/USD (British Pound to U.S. Dollar), USD/CHF (U.S. Dollar to Swiss Franc), EUR/GBP ( Euro to British Pound) and EUR/CHF (Euro to Swiss Franc).
The American session coincides with the second half of the London trading session. Judging from the high trading volume and dynamic price movements of the US dollar pair, this is a “hot period” in the market
At this time, traders are watching news from the United States and browsing the economic calendar. All changes are reflected in stock prices, crude oil (Brent/WTI), gold, and the US dollar exchange rate.
It is also worth noting that the Russian time that occurs on the Moscow Stock Exchange overlaps with both the London time and the US time. Here, investors will pay more attention to news that may affect the ruble-related currency pair.
When is the Best Time (Hours) to trade Forex?
How to trade in financial markets?
The financial market is divided into: stock market, metals, bonds, futures, etc. But the most popular is the currency market foreign exchange (foreign exchange trading)
Let us take it as an example to understand the principle of trading through a trading platform (an online program with price charts).
Therefore, in the foreign exchange market, the price of a country’s currency (such as the US dollar) reflects the market’s view of the current and future conditions of the country’s economy.
If the announcement is positive, currency quotes will start to rise.
If you successfully create a transaction (by clicking the buy button on the online platform ) and hold it until the price rises, you can make a profit, which will be displayed on your trading account immediately. At this time, closing the transaction can lock in revenue.
If the forecast is inaccurate and the price drops, your trading will be in deficit.
Place orders on FXPro’s Web Trader
Open a trading platform in the browser, such as MT5. You can see from the currency pair that the value of one currency is displayed in units of another currency. It reflects the economic situation of the two countries compared to each other.
In the foreign exchange market, when you buy (the first currency) in a currency pair, you are also selling (the second currency). Just like a bank exchange office, where you buy euros in U.S. dollars (or other currencies). The exchange rate at which you buy Euros is an example of a Euro/Ruble quote.
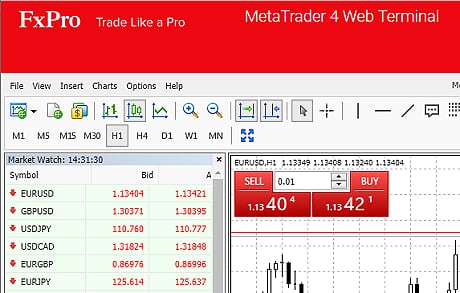
When you click Buy, you create an order to buy EUR/USD.
When you click Close, the transaction is completed (just like selling EUR/USD, but you really don’t need to do this).
Facts have proved that each of your transactions is a link in an endless chain of buying and selling. Someone sells, and you buy. You closed the transaction (sold the asset)-but someone bought it at that time.
We remind you that you are only investing in price changes as a speculator, rather than actually earning a lot of money.
Buy orders are called long positions.
The sell order is called a short position.
Base Currency and Counter Currency
Major currencies embody the world’s largest economy, which is why they are called “main”.
Major currency pairs usually consist of two major global currencies, such as EUR/USD, GBP/USD, USD/JPY, EUR/GBP, USD/CAD
Since the major currency pairs are very popular, they are very liquid, so transaction fees are slightly lower than others. (I.e., spread).
Other currency pairs are classified as ” mini” or ” micro” currency pairs.
You can view the classification of each product through the platform properties.
To understand this, consider the following example (how many dollars does it cost to buy 1 euro):
EUR/USD = 1.07407
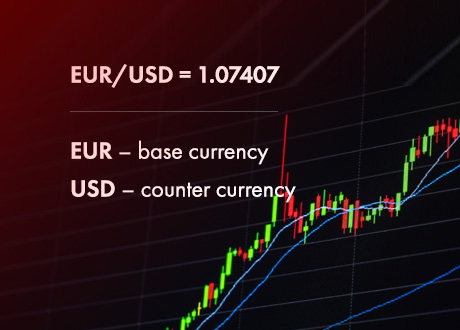
The trend of the euro/dollar shows that 1 euro is equal to 1.07407 US dollars. This means that you need 1.07407 USD to buy 1 Euro, or you can sell 1 Euro to get 1.07407 USD.
In this example, the euro is the base currency (we want to determine the price of this currency), and the dollar is the relative currency (the currency that represents the price).
Now you should remember that the base currency is the basis for buying and selling.
Go to FXPro’s Official Website
Difference between Bid and Ask prices
What is the bid/ask price, and what is the difference between them?
Take another look at the chart on your trading platform. Can you see a virtual “table” with two columns, where the quotes are constantly changing and highlighted in two colors.
For example, for EUR/USD, it can be:
- Buying price 1.06838
- Selling price 1.06853
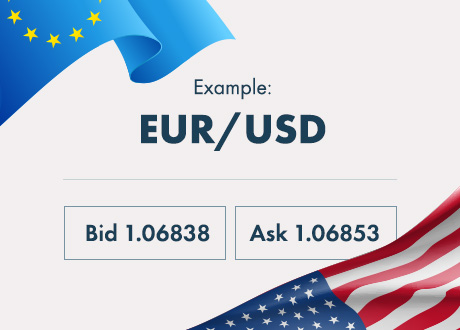
The bid price is the initial price of the order when you decide to create a sell position. This quote is in the left column.
The selling price is the initial price of your buy position. This quote is in the right column.
At the bank exchange office, you will encounter the same thing: get two different prices for buying and selling currencies.
Therefore, your order revenue will initially show a small negative number until the price exceeds the difference between the buying price and the selling price, that is, the spread. Therefore, the smaller the spread, the better for traders.
Go to FXPro’s Official Website
Types of charts on FXPro MT4 and MT5 platforms
The price of assets in the financial market changes every second. Once a new quote arrives on the trading platform, it will form one of the following three main types of charts:
- Line chart
- Bar chart
- Japanese candle chart
Here are some important points to know about charts.
- OHLC represents the opening price, the highest price, the lowest price and the closing price in a specific period.
- Above the chart is generally the selling price line displayed by default; the buying price can be added in the form of a horizontal line on the icon.
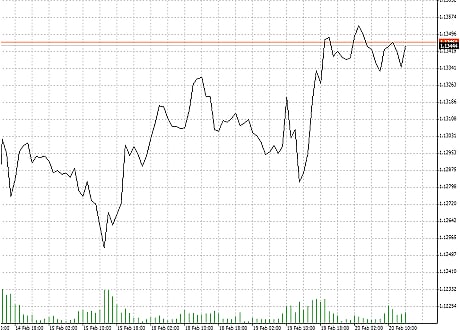
- The line chart is the most basic-only the closing price is drawn.
- The histogram shows all the information for a specific time period.
- Candlestick chart is the most popular and easy to read chart type, showing all the information for a specific time period.
- Candles are composed of’physical’ (opening & closing prices) and’wicks’ (high price & low price).
Which MT4 chart type is the best to analyse market trend?
1. Line Chart
The mapping of the line chart is the easiest for novice traders to understand: all quotes are connected by a line.
However, for professional analysts, it is not enough to see whether the main price trend is rising or falling. Therefore, this type is only suitable for superficial research on price changes.
The following is an example of a EUR/USD line chart:
Trade CFDs with FXPro’s Line Charts
2. Bar Chart
Charts like bar graphs provide more information. For example, you can learn:
- Opening price
- Closing price
- The highest price recorded during the selected period
- The lowest price recorded during the selected period.
Look at the example of the Euro/USD bar chart below.
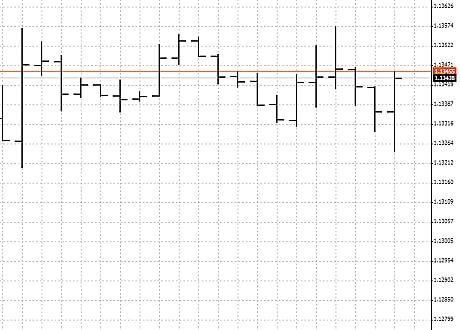
The bar graph consists of one vertical line and two small horizontal lines: upper right and lower left.
The horizontal line on the left represents the opening price of the asset, and the horizontal line on the right represents the closing price of the asset.
The vertical line itself shows the price range of entering the trading platform for a specific time period (1 minute, 1 hour, 1 day, etc.). The lower edge of this vertical line represents the lowest quotation level during this period, and the upper edge represents the highest quotation level.
Trade CFDs with FXPro’s Bar Charts
3. Japanese candlestick charts
As early as the 19th century, Japanese rice merchants invented the method of drawing “candles” to express income and expenditure. Now, it is considered the most convenient and most popular chart for traders and analysts.
This is an example of a EUR/USD candle.
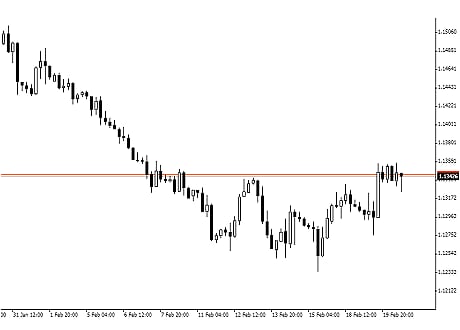
Each candle represents an equal period ( time frame ) set by the trader himself. For example, you can see the price per minute (M1), every 5/15/30 minutes (M5, M15, M30), every hour (H1), every 4 hours (H4), every day (D1), every week (W1), And monthly (MN) changes.
One cycle = one candle.
Each candle consists of a “body”: the bottom is the opening price, and the top is the closing price.
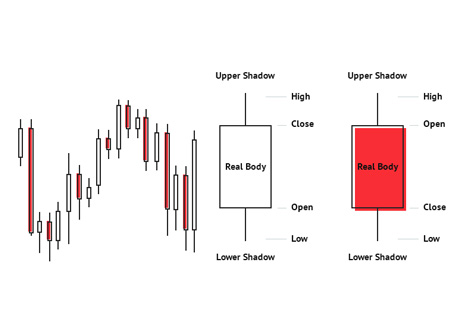
If the price increases during this period, the opening price is at the bottom and the closing price is at the top, and the color of the candle body is green (or white).
The reverse is also true: if the price falls, then the opening price is the upper horizontal line and the closing price is at the bottom. The same candle becomes red (or black).
Note that there is a straight line above the candle, this is the shadow, and there is another line below, the shadow. They represent the highest and lowest quotation levels of the trading platform during the selected time period.
Trade CFDs with FXPro’s Cnadlestick Charts
The basis of point value
The basis point is the minimum value of changes in the price of a financial asset. For currency pairs, the basis point usually refers to the fourth decimal place. But the Japanese yen is an exception: in the dollar/yen, the basis point is the second decimal place.
The quotation of the currency pair is displayed as follows:
- EUR/USD = 1.0733
- GBP/NZD = 1.9502
- USD/JPY = 119.968
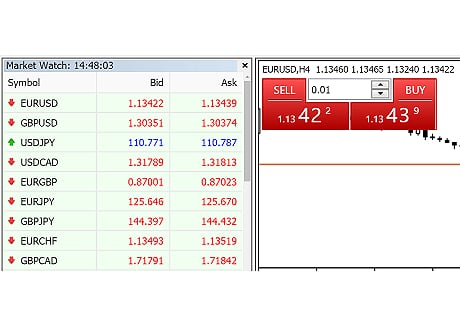
The ‘price ladder’ is calculated in points. The price of each asset consists of several basis points. Detailed information can be found in the “Specifications” section of the FxPro website.
Why do we have to talk about this in such detail? Because in fact, your profit or loss is calculated based on the number of points that the price changes in the “good for you direction” or “unfavorable direction”.
There is a logical question: if the quotation of a financial asset is measured in points, why should it display 4 or even 5 digits after the decimal point, and usually pay attention to the basis point? In fact, to more accurately reflect price changes, you need to use basis points.
The basis point should not be confused with the number of points: the basic point is the smallest unit of price change. The point is the smallest unit of a step-change in the price of an asset.
What are pip and Fractional pip in the Forex market?
What is the lot size?
The lot size is the smallest trading volume in the market. For example, 1 lot of foreign exchange includes 100’000 units of base currency. For EUR/USD, 1 lot is 100,000 Euros.
Thanks to the existence of a broker, individual traders can buy and sell mini-hand and micro-hand orders. This means that you don’t need to spend 100’000 euros to trade with a minimum transaction volume: only 10 euros is enough.
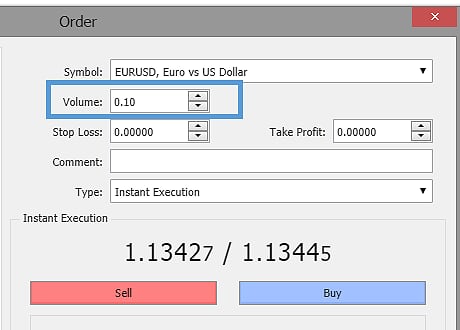
In foreign exchange, a’Tick’ reflects a single price change, regardless of how many points the price changes. Price changes are not necessarily carried out point by point. For example, if the price of EUR/USD changes from 1.10564 to 1.10567, although the price changes by 3 points, there is one tick.
For other types of asset classes such as futures and commodities, a ‘tick’ reflects the smallest possible price fluctuation and is usually used to calculate profit and loss.
For more details on special product features, please check FxPro official website.
- Point value, points and ticks are all used to describe how market prices move.
- In foreign exchange, the point value usually refers to the fourth digit after the decimal point (Japanese currency pairs use two digits after the decimal point).
- Point is the smallest unit of change.
- Spreads and profit/loss are calculated by multiplying the point value by the number of points.
- The point value of one lot is 10’denominated’ currencies (currency pairs denominated with four decimal places).
- Points and Ticks are used for products of different asset classes.
Go to FXPro’s Official Website
Please check FXPro official website or contact the customer support with regard to the latest information and more accurate details.
FXPro official website is here.
Please click "Introduction of FXPro", if you want to know the details and the company information of FXPro.


 IronFX

FXGT Broker Review: A Leader in High Leverage Forex and Cryptocurrency Trading
Comment by whatisgoingonTRUMP
February 17, 2025
Trump’s team holds 80% of the $TRUMP token supply, giving them the power to influence prices and put investors at risk. A crypto controlled by one group? Doesn’t seem very decen...