The use strategy of “divergence” in trading
Since most definition deviations are related to MACD, the author summarizes its basic definition. Divergence means that the price trend does not match the strength of the bullish and bearish sentiment behind it. Under normal circumstances, the steady rise of market prices is accompanied by an increase in bullish views, which is the so-called increase in both volume and price. However, if prices rise at the same time, the strength of bulls’ views will shrink. Under such circumstances, price trends tend to It is difficult to maintain for a long time, and there is greater correction pressure, which is a deviation.
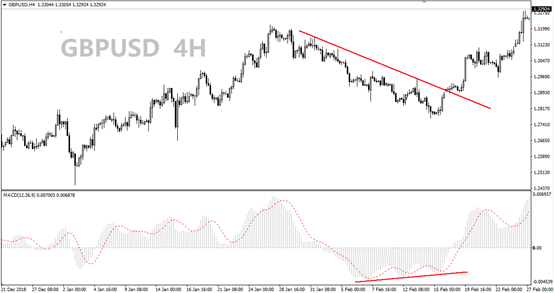
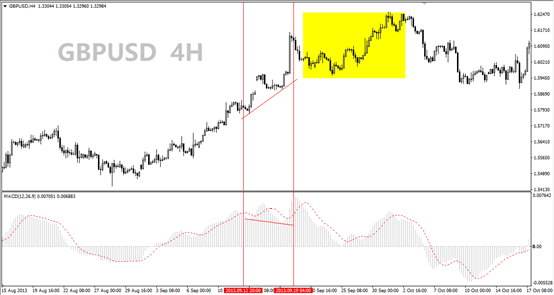
According to the running direction of the disk surface, the deviation is generally divided into top deviation and bottom deviation. Top divergence means that while the price is rising, the strength of the bulls weakens, and there is strong downward pressure, and the market outlook is bearish; the bottom divergence is just the opposite. At the same time as the price is falling, the strength of the bears is weakened, and there is strong upward pressure. The market outlook is bullish.
Reflected by MACD, the top divergence is the continuous decline of the high point formed by the last line, which is the opposite of the trend of the K line; similarly, the bottom divergence is the low point formed by the fast line continuously rising, while the K line is temporarily still down.

Divergence is generally regarded as a departure disk is a trend reversal signal, but I want to correct it, away from the signal occurs, the disk can only prompt corrective situation in the next short period of time possible, New trend confirmation requires more signals to appear, and divergence is not one of them.
In addition, the top divergence is more accurate than the bottom divergence. This is what the author thinks. It is always easier to spread panic in the market than to build market confidence. Therefore, in the stock market, the bottoming before the rise is very long, and the preparation process before the high fall is relatively short, so there is a deviation. At the same time, the accuracy of the bottom deviation is relatively low. Even though the difference may not be so obvious in the foreign exchange market, it can be considered that this law exists.
In addition to the above-mentioned top divergence and bottom divergence, there is also a hidden divergence.
Taking MACD as an example, implicit divergence refers to when the price has a higher low, but the MACD fast line forms a lower low, which implies that the upward trend will continue. When the price has a lower high, but the MACD fast line forms a higher high, it implies that the downward trend will continue.
Therefore, contrary to the aforementioned “top divergence” and “bottom divergence” suggesting a trend reversal, the recessive divergence confirms that the trend continues.

The divergence identified on OANDA MT4 is mostly linked to the MACD. Some people mentioned that the RSI indicator and KDJ indicator also have such a divergence, but the author believes that the latter two are in the strength of long and short on the disk. The manifestation is not obvious, and the deviation situation is relatively not good enough.
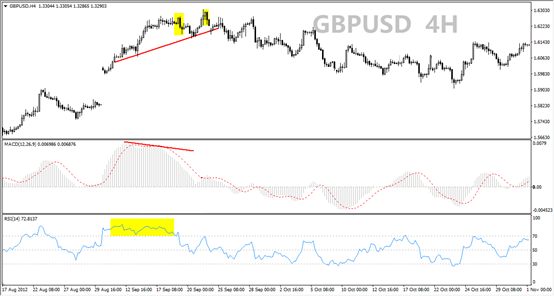
Regarding divergence, the reason why the author has not liked it much is that it has a very limited effect on entering the foreign exchange market (the foreign exchange market is popular for chasing ups and downs, and is not suitable for bottom hunting or top hunting), but it cannot be denied that it has a warming effect on exit. In particular, it can be determined that the disk has been seriously overbought or oversold, and a divergence signal appears at this time, so you can basically prepare to leave the market. According to the trading rules of excellent traders: do not eat fish heads and tails, deviation plays a role in the “fishtail” part. In the process of use, in order to clarify the status of overbought and oversold, on the one hand, you can look at the correction status during the market trend (for example, the increase is obvious, but there is no obvious retracement during the period), on the one hand, you can directly use other overbought and oversold indicators.
For example, after the MACD appears top divergence, the RSI indicator has been passivated in the overbought zone for a period of time. This can be considered for entry. Once the K-line has a clear reversal pattern, such as the engulfing line, it is considered for the exit.

Adding RSI and MACD indicators simultaneously, it is not contrary to the author does not recommend more than one point of view oscillators do? When you do establish a trading system, generally do not add too many oscillators, but when the RSI indicator is severely passivated, temporarily add MACD to observe whether there is a deviation, or conversely, when there is a deviation in the MACD, temporarily watch the passivation of the RSI indicator.
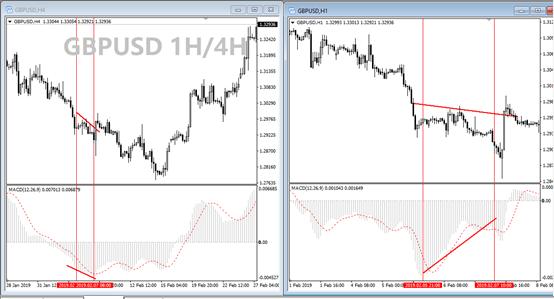
In addition to cooperating with the MACD overbought and oversold indicator to consolidate the accuracy of the divergence signal, the divergence of different cycles can also be used to assist in judgment. For example, if there is a divergence in the 1H chart, and there is no divergence signal in 4H and Tiantu, and the overbought and oversold are not serious, the divergence of the 1H chart may not bring an obvious trend reverse operation effect.

The divergence signal does not indicate a clear trend stop time and location, we can use this more as a signal to prepare to exit the market.


 Deriv
Deriv  AdroFX