Trade USFANG stocks. Table of Contents
Invest in USFANG stocks with XTB
Tech stocks like Apple, Facebook or Netflix are not only among Wall Street’s top assets, but they have also transformed the way we live.
As its prices soared, skeptics began to argue that a new bubble was being created.
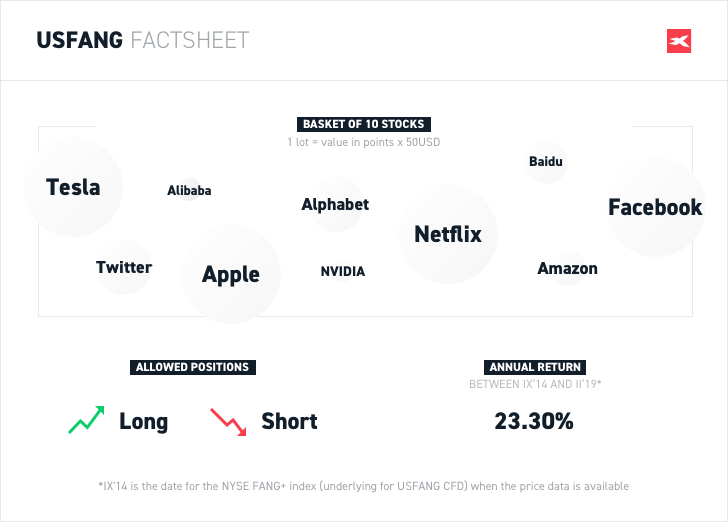
As a result, the FANG index was created, which stands for Facebook, Apple, Netflix and Google, it is actually composed of 10 technology stocks in equal proportions.
In this article, we present 3 ways to use USFANG CFDs that are based on the NYSE FANG + index.
Strategy 1 – Portfolio of Stocks
The CFD index has two main strengths: leverage and scalability.
If you want to invest in the top 10 tech stocks – Alibaba, Alphabet, Amazon, Apple, Baidu, Facebook, Netflix, NVIDIA, Tesla, and Twitter – you’ll need a lot of capital.
But with USFANG you not only have them included in an index, but you will also only need a deposit of 10% of the investment to take a position thanks to the leverage.
Scalability allows you to get the largest position you want.
One lot represents a point value of $ 50, so if the index is at 2,600 points, it would be $ 130,000.
However, if you want your position to be $ 50,000, you can invest in 0.38 lots.
To do that, you only need to have a deposit of $ 4,940.
Strategy 2 – Outright Short
While you can buy 10 stocks separately, this is only profitable if prices go up.
What if you think tech stocks are overvalued? Taking a short position on the USFANG CFD is a great way to take advantage of that valuation.
Your trade will make a profit as USFANG declines.
Again, you are taking advantage of leverage and scalability just like with Strategy 1.
Despite the strong correction in 2018, the NYSE FANG + returned 23.3% annually between September 2014 (start date) and the end of February 2019.
USFANG is a CFD based on that index that is available on the xStation platform.
Please note that the data presented refer to past performance and therefore does not guarantee future returns.
Strategy 3 – Speculative Hedge
This strategy can be used for investors who already have a portfolio of stocks.
If you have a portfolio of stocks that is worth, say $ 20,000 and you like the stocks you have but think tech stocks are overvalued, you can consider a short USFANG CFD position (0.15 lots that would represent $ 19,500 with the index at 2,600 pts).
Such a transaction simply assumes that your portfolio of stocks will perform better than stocks included in the NYSE FANG.
You can even make a profit during market downturns if the USFANG CFD loses more than your portfolio.
Invest in USFANG stocks with XTB
Follow Macroeconomic Data on XTB’s xStation
The most popular methods of market analysis can be divided into two types:
- Technical analysis
- Fundamental / macro analysis
While technical analysis focuses on the analysis of charts, fundamental analysis it is based on the analysis of political and macroeconomic events.
The traders tend to focus on the most important macroeconomic readings affecting markets and provide volatility.
The effect on the market depends largely on the comparison between the actual reading of a macroeconomic reading and the predicted value, where the greater the difference, the greater the effect on the market.
In addition to macroeconomic data, one of the most important factors in fundamental analysis is the monetary policy carried out by central banks.
Interest rates, open market operations, and central bank interventions influence the situation in the market and are closely watched not only by the financial analyst but also by traders.
It is important to note that in general any significant event in a country or region that can influence politics or the economy can also affect the market.
This means that it can also be connected to unexpected events such as natural disasters and statements made by government officials and central bank governors.
In order to keep up with macroeconomic events.
Station users do not have to use external links to follow macroeconomic events because the market calendar is included as one of the platform’s functionalities.

What are important Macroeconomic indicators?
To be successful in your investments, it is important that you learn to understand the publications of macroeconomic data and indicators.
To begin, we will explain key macroeconomic indicators that have a great influence on the market:
1. GDP – Gross Domestic Product
GDP is the most important indicator of a country’s economy, and it tells us the total market value for all goods and services generated in a specific year. GDP is often seen as an indicator to follow, which is why a significant number of investors rely on two reports that are published months before the final and preliminary GDP report.
These reports can cause considerable volatility in the market.
Follow GDP data releases with XTB
2. CPI – Consumer Price Index
CPI – Consumer Price Index is surely the most important inflation indicator.
It is a statistical estimate created by using the prices of a representative sample of items whose prices are collected periodically.
The CPI simply measures a rise in the prices of goods and services, and is divided into categories and subcategories.
If the CPI disclosure is higher than expected, it means that inflation pressure is high and that the central bank may raise interest rates, which would lead to an increase in the value of the currency.
Follow CPI data releases with XTB
3. Retail Sales
Retail Sales is an indicator that is revealed every month and is critical information for FX traders as it exposes consumer spending.
The higher the number, the greater the expectation of the economy, so a positive publication warns that the expectation is greater in an upcoming GDP growth.
Since the fundamental analysis is based on the observation and analysis of macroeconomic scenarios, we will look at the publications with more attention.
Follow Retail Sales data releases with XTB
4. Employment data
Employment data can also be a significant factor in financial markets.
Two of the most influential data releases are US unemployment rates and non-farm payrolls.
Unemployment rates show the percentage of the total workforce that is unemployed but actively looking for work and interested in working.
Before analyzing the market reaction with the employment data, we will observe the internal dependence of the labor market.
The continuous increase in the level of unemployment is a reflection of the deterioration of the financial situation of the country, which the markets perceive negatively as a sign of a decline in the currency.
The market deduces that the higher the unemployment level, the weaker the currency.
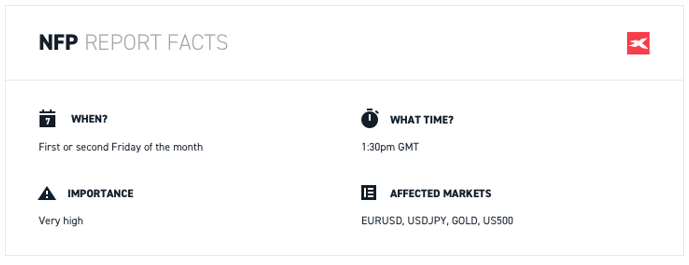
The most notable cyclical data released in the US is released every first Friday of the month at 2:30 pm, and is known as Nonfarm Payrolls or NFPs.
The jobs generated lately in all sectors except agriculture reflect the economic situation of the country.
High index values are a positive indicator and can contribute to the appreciation of a country’s currency.
In this case, the NFPs was much higher than expected, which generated a strengthening in the value of the dollar.
Follow EMployment data releases with XTB
5. The impact of interest rates on currency exchange rates
Every trader should bear in mind that an increase in interest rates means for many investors that the investment is more reliable in that country.
Free capital “circulating” in the global market can be quickly transmitted to the strengthening of the currency, causing its appreciation.
The opposite situation, the reduction of interest rates, causes the currency to lose value.
Take as an example the Council of the European Central Bank suddenly lowering key interest rates by 25 basis points to 1.25%.
Let’s analyze the attitude of the EUR / USD market:
As can be seen, the publication of important data directs the market and increases volatility.
Please note that the market reaction often varies depending on market sentiment or expectations anyway, and can often be already listed or discounted.
If you want to know more about other influential macroeconomic indicators, you can participate in XTB training webinars.
Be aware of Non-Farm Payrolls Report (NFP)
US Non-Farm Payrolls (NFP) is arguably the most popular report among investors. In this article we explain why this is so important and give examples of the real market reactions to past report releases.
The NFP: The Heart of the American Economy
The Federal Reserve, the world’s largest central bank, has two main objectives: low and stable inflation and full employment.
When investors want to guess the future movements of the Federal Reserve, they first look at the NFP report.
High job growth means a lower unemployment rate and can create inflationary pressure.
This is why high job growth is usually good for the US dollar.
However, how high should it be? This is relative since the data is compared with market expectations.
You can see what the markets are expecting on the economic calendar on the xStation platform.
Let’s take a look at the examples.
Example 1 – Weak NFP report
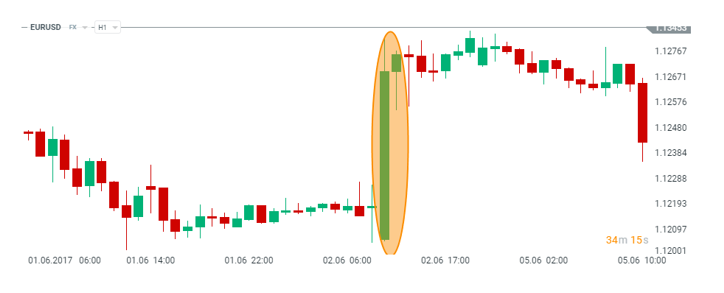
The NFP report from May 2017 showed an increase in employment of 138 thousand people.
This is not necessarily a bad number, but it was lower than what the market expected: the consensus saw an increase of 182 thousand people, therefore a minor increase in employment was a disappointment for investors and pushed the dollar to lowers it.
Consequently, the EURUSD rallied quite abruptly as a result.
Why is Nonfarm Payroll (NFP) so important?
Example 2 – Strong report from the NFP
The opposite situation occurred after the publication of the report in December 2018.
It showed employment growth of up to 370 thousand people, while only 184 thousand people were expected.
As a result, the US dollar strengthened with the release of the report and the EURUSD fell.
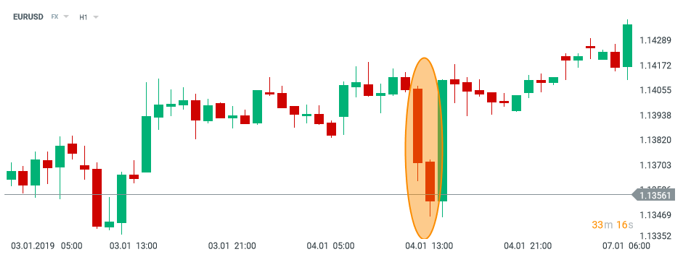
As can be seen, the NFP report has a significant impact on the EURUSD.
Investors can prepare for the release of the report using technical analysis to look for interesting entry levels to take positions.
Utilize XTB’s Market Screener to make a better decision
XTB’s market screener is a very practical tool that is useful to identify potential trading opportunities in a faster and more efficient way.
For example, if you are interested in companies with a P / E ratio greater than 1.5, or you are only looking to invest in large amounts of stocks, this is where we can use the market screener.
The interesting thing about the screening tool is that it gives you the ability to search hundreds of global markets in an instant, allowing you to filter results with a wide range of specific criteria.
This can help you in your trading strategies, saving time and effort in the long run.
Using the screen is easy and intuitive. On the left is a “Fundamentals” headline, and below it are several scroll bars that slide down.
These are: Market Capitalization, EPS, P / E, Dividend Yield and Profit Margin.
By analyzing and determining the limits above and below in each specific ratio, the screening tool will only show the actions that meet those conditions.
By clicking on each specific instrument, the tool directs you to the market page where you can view more information about the stock, including market sentiment, trading activity and the latest news.
You can refine your search with the drop-down menu to set a specific sector or country.
Since fundamental analysis is so broad, you can use a large number of financial ratios to filter a large range of stocks at the same time.
Visit XTB’s Official Website for more
Please click "Introduction of XTB", if you want to know the details and the company information of XTB.


 IronFX

Comment by Diletta
March 26, 2024
Awesome bonuses, good leverage. A few hiccups, but support rocks!