Open OctaFX's Account. Table of Contents
How to open OctaFX Trading Account?
OctaFX mainly offers MT4 and MT5 trading account types.
See the table below to know the difference between these trading account types
| Account Type | OctaFX MT5 | OctaFX MT4 |
|---|---|---|
| Spread Type | Floating | Floating |
| Minimum Spread | 0.6 pips | 0.6 pips |
| Trading Commission | None | None |
| Minimum Deposit | 100 USD | 100 USD |
| Available Markets | 35 currency pairs + gold and silver + 3 energies + 10 indices + 30 cryptocurrencies |
35 currency pairs + gold and silver + 3 energies + 4 indices + 30 cryptocurrencies |
| Maximum Leverage | 1:500 | 1:500 |
| Minimum Trading Volume | 0.01 lots | 0.01 lots |
| Maximum Trading Volume | 500 lots | 200 lots |
| Execution Model | Market Execution | Market Execution |
| Execution Speed | Less Than 0.1 seconds | Less Than 0.1 seconds |
| Account Currency | USD and EUR | USD and EUR |
| Margin Call Level | 25% | 25% |
| Stop Out Level | 15% | 15% |
| Hedging Strategy | Allowed | Allowed |
| Scalping Strategy | Allowed | Allowed |
| Use of EAs | Allowed | Allowed |
| Swap Points | None | None |
| Cryptocurrency Trading | Available | Available |
| Sign Up Link | Open OctaFX MT5 Account | Open OctaFX MT4 Account |
Open OctaFX’s Account for free
1. Open an account with OctaFX
With an OctaFX account, you can enter the foreign exchange market and start trading.
After registration, you will receive an email containing your personal area login details, trading account credentials, and necessary information and instructions.
You need to log in to your personal area to manage your funds, get bonuses, and participate in OctaFX’s promotional activities.
Trading account credentials are used to access the trading platform itself.
Open OctaFX’s Account for free
2. Deposit
Log in to your personal area to make a deposit without any handling fees.
At OctaFX, you can start trading as low as $25.
The minimum deposit amount may vary depending on your region and payment method.
According to the basics of risk management, the more funds you have, the less risk you face.
3. Log in to the web trading platform
The web page trading platform does not need to be installed, allowing you to trade through any device anytime, anywhere.
Alternatively, you can download a desktop version of the trading software, or you can also download OctaFX mobile trading software for Android phones.
You can compare trading software on different platforms and choose the best one to trade.
4. Start trading
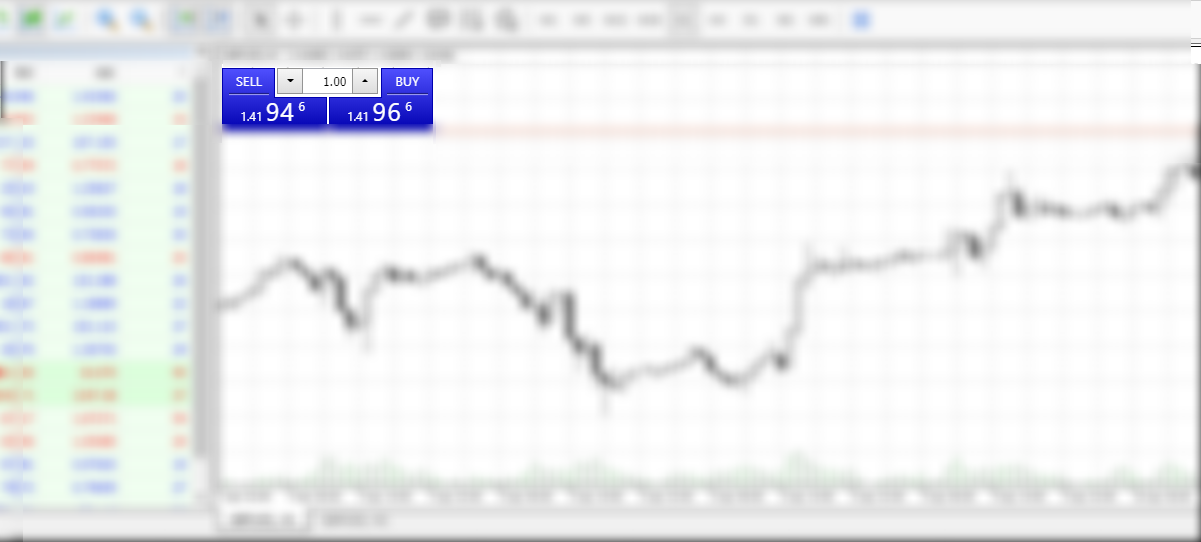
When placing an order, you only need to set the number of trading lots, and then press buy or sell.
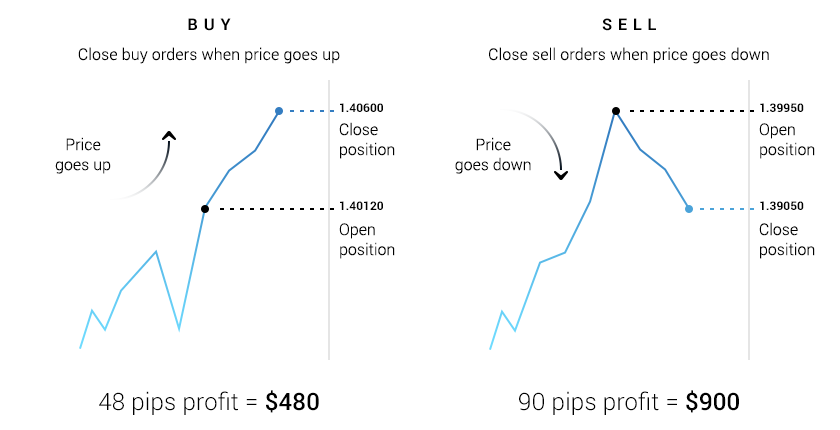
Basically, if you expect the price to rise, you place a long order, and if you expect the price to fall, you place a short order.
This means that you buy a certain quantity at a lower price, and then sell it at a higher price, and profit from the spread.
Set up a proper leverage of your account
Leverage reduces the margin requirement, that is, the amount required to hold a certain position, and helps you place orders that exceed your balance.
It should be noted that the larger the number of orders, the greater the gain or loss of each pip value.
Suppose you have a trading account with an account amount of 500 USD and a leverage ratio of 1:500.
When the EUR/USD price is 1.13415, you decide to open a long position of 1 lot (100,000 USD).
The margin required for this position is $226.83, which is almost half of your funds. The value of each point is $10.
Therefore, the price only needs to fall to 1.13145, and you will lose almost all of the money in your account.
If you place 0.5 lot, each pip is worth $5.
In this case, if the price drops to 1.13145, your loss will amount to $135.
This should be taken into consideration when making trading decisions and assessing the potential risks of unfavorable price fluctuations.
Find out more about OctaFX’s leverage
Forecast and predict price movements
As a beginner, you can simply follow the general direction of the price on the chart and establish a long position when the price is rising, or a short position when the price is falling.
This may not allow you to win a guaranteed profit every time, but it is a good start to develop your trading strategy.
If you have almost no experience, it is best to avoid trading during major news releases, when the market is often volatile.
Two more advanced price prediction methods are technical analysis and fundamental analysis.
Facts have proved that basic risk management techniques can also help reduce losses.
Open OctaFX’s account for free
Make a profit
There are many trading strategies that allow you to profit from currency price fluctuations, such as scalping, martingale, hedging, news volatility arbitrage trading, and so on.
Please read OctaFX’s article to find a detailed description of the most common trading strategies and choose the one that suits you best.
Learn How to trade Forex and CFDs with OctaFX
Close your orders
Your order profit will change with the current market price, until the moment you close your position.
If you feel that you have made huge profits, open the “Trade” tab on your trading platform, find the order in the position, press it, open the menu, and select “Close Position”.
Manage risks smartly to earn stable profit
Risk management, also known as money management, refers to a series of trading techniques used to reduce risk.
Affected by various factors, exchange rate volatility may be great from time to time, so protecting your funds from the adverse effects of price fluctuations is an important part of a trading strategy.
The core idea of fund management is to avoid any single transaction exceeding 1-2% of a person’s funds.
This principle can greatly reduce the risk: only 1% of the initial margin is at risk, and even after a few failed transactions, you are likely to retain most of your account balance.
The risk-reward ratio refers to the ratio of potential profit to loss in a given transaction.
For example, when you take a risk of $100 to hold a position and get a profit of $300, the risk-reward ratio is 1:3.
A ratio of 1:2 is considered to be the most basic goal, which means that only one-third of the funds will need to be profitable to ensure no loss.
Potential profit and loss can be determined by stop loss and take profit levels.
Stop loss and take profit orders are closed when the price reaches a certain predetermined level.
Stop-loss or take profit levels can be identified by various technical analysis tools:
- Support and resistance levels: The stop loss of a short position is usually placed above the resistance level, while the stop loss setting point of a long position is often below the support level.
- Trend lines and channels: Stop loss prices are usually placed outside the channel, above or below the trend line.
For example, you open a buy order of 1 lot of EURUSD at 1.12097.
In order to achieve a 1:2 risk-reward ratio, you can set a stop loss level at 1.12077 (2 points) and a take profit at 1.12137 (4 points).
Therefore, you only need to bear the risk of a loss of $20 and get a profit of $40.
According to your initial margin, you can even further set the SL/TP level, as long as your risk-bearing funds are less than 1-2% of your personal funds.
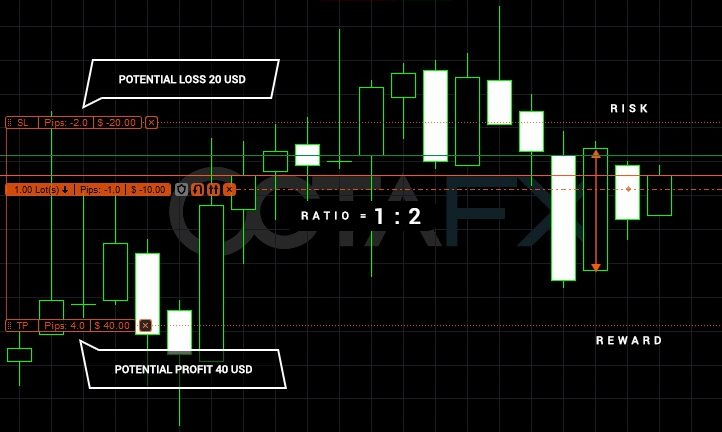
It should be noted that the price of each point depends on the size of the trading instrument and your position.
You can find the point value per 1 standard lot, the spread and conditions page or easily calculate it here.
Trailing stop loss can be used to automatically adjust the stop loss level when the price fluctuates in a favorable direction.
As the risk decreases, it is also possible to lock in the profits already obtained.
But please remember that neither stop loss nor take profit guarantees profit: when the market fluctuates or there is a price gap, your order may be executed at a different price than expected.
You can learn more about relevant events and indicators that have an impact on market volatility here.
Technical Analysis – Base of Forex Trading
Technical analysis is a method of predicting price trends, involving chart pattern recognition.
Analysts use various tools to identify support and resistance levels, upward and downward breakthroughs, trends and trading ranges.
Knowing the basic strategy, traders find that they can incorporate some key elements into their own strategies.
Open OctaFX’s MT4, MT5 or cTrader account
Types of Price Charts
A chart is a graphical representation of how the price changes over a period of time.
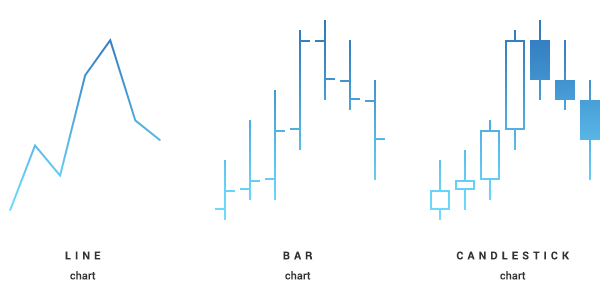
In almost all trading platforms, you will find candlestick, histogram and line chart types.
All three charts are based on the same data, but show them in different ways.
- The line chart is a simple and basic chart that only shows the closing price.
- In the histogram, you can observe the opening, high, low and closing prices for each time. The vertical lines are generated by the highest and lowest prices. The dash on the left shows the opening price and the dash on the right shows the closing price.
- The most popular type-candlestick chart displays the opening, high, low and closing prices in a set time period. Each candlestick has a “cylinder” drawn by the opening and closing prices, and a “wick” drawn by the highest and lowest prices. This type of chart is usually represented by two different colors-bullish candlestick and bearish candlestick. The closing price of a bullish candlestick is higher than the opening price, while the opposite is true for a bearish candlestick-the closing price is lower than the opening price.
Time Frames
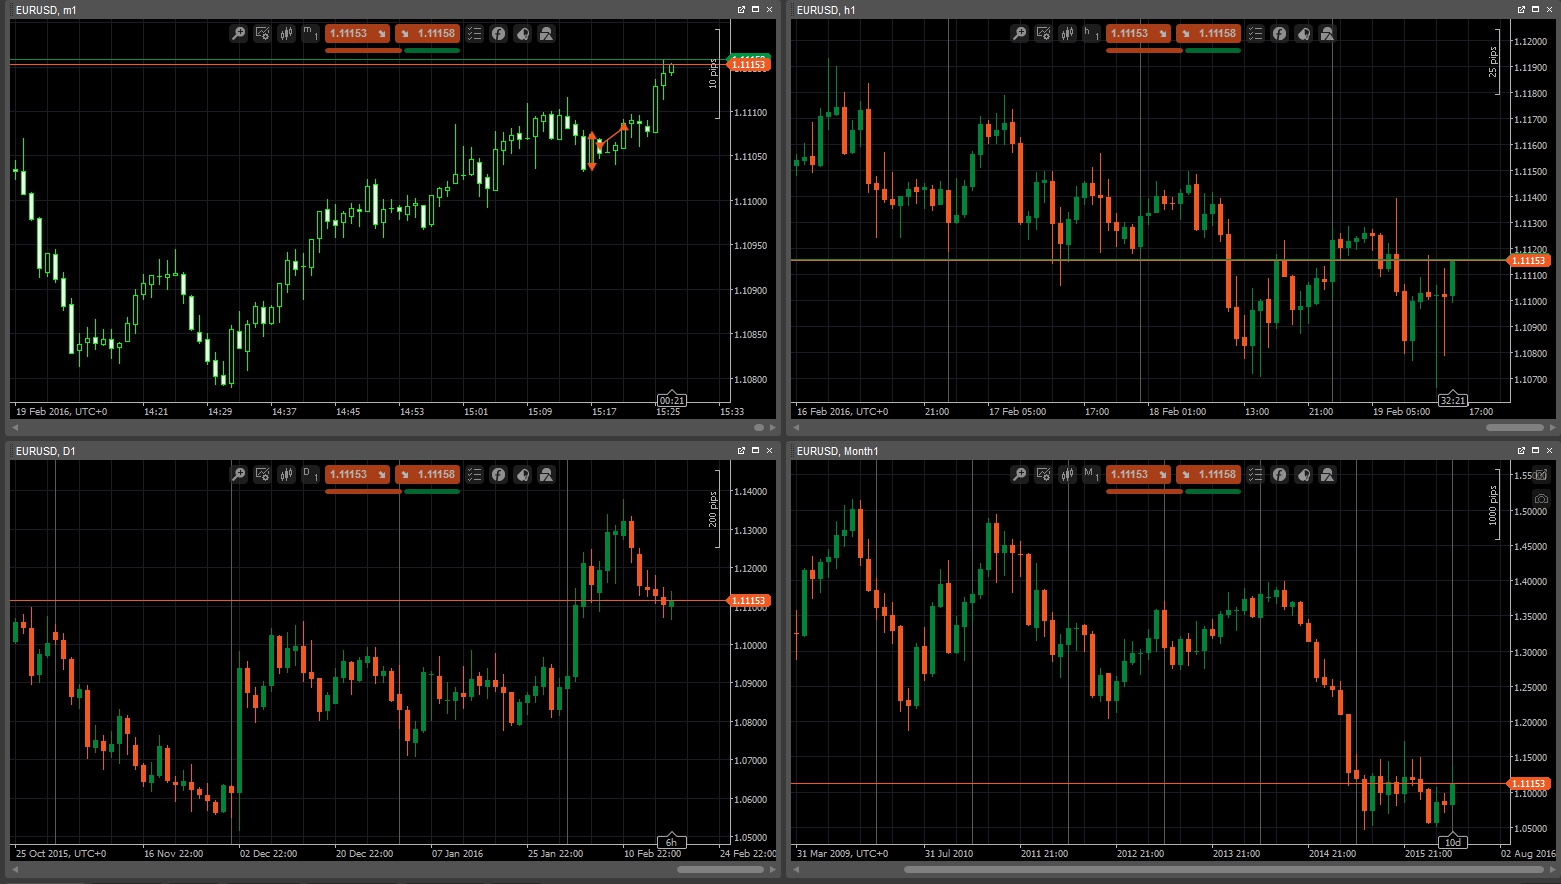
The time frame refers to the time required to draw a candle or a bar, and how much information is included in the period.
For example, the time limit H1 shows the fluctuation of the buying price within one hour.
You can customize the time frame for each chart on the trading platform.
In general, short time frames are considered to generate more signals, however, a significant part of them is often wrong.
On the contrary, longer time frames provide relatively few signals, but they release stronger signals and portray trends more prominently.
Market Trend
Identifying the trend or the direction of market movement is one of the basic techniques of analysis.
Occasionally it can be judged by simply looking at the chart.
In other cases, more in-depth analysis of price data will be required.
There are two main types of market trends:
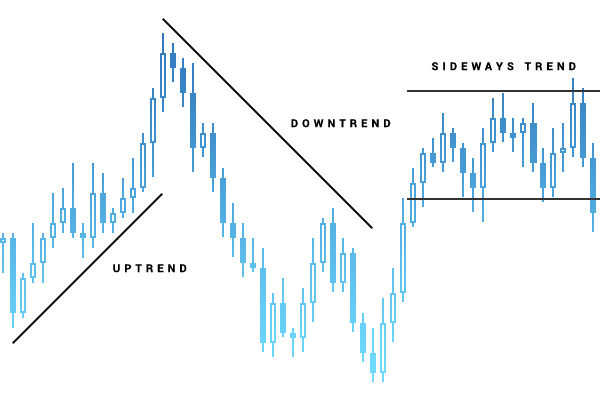
- Uptrend-a series of rising highs and lows; most of the lows are connected to form an upward trend line.
- Downtrend-a series of downward highs and lows on the chart. The connection of most highs forms a downward trend line.
The lack of any specific directional trend is called a sideways or horizontal trend.
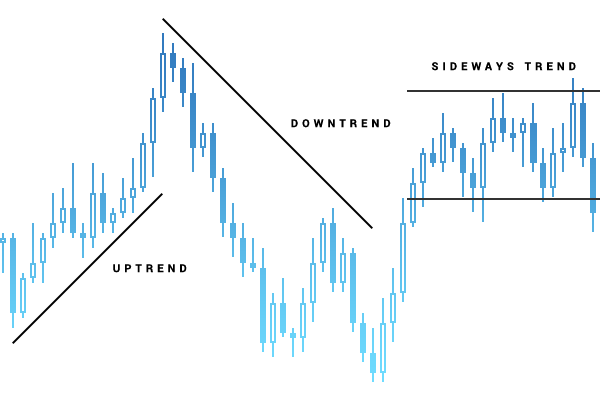
To determine a trend, you can simply draw a straight line in the direction of price fluctuations on the chart.
“Trendline” is one of the technical analysis tools available for beginners in almost every trading platform.
Another option is a technical indicator that can be measured and displayed trends after being added to the chart.
Support and Resistance Levels
Finding support and resistance levels can determine when and in which direction a position should be opened, as well as the potential profit or loss level.
Support is where the price encounters difficulties when the price goes down, and resistance means that a currency pair has encountered difficulties in rising prices.
These price levels will not be maintained for a long time, and sometimes an upward or downward breakthrough in one direction will occur.
Support and resistance levels form a trading zone-a a horizontal corridor containing price fluctuations over a period of time.
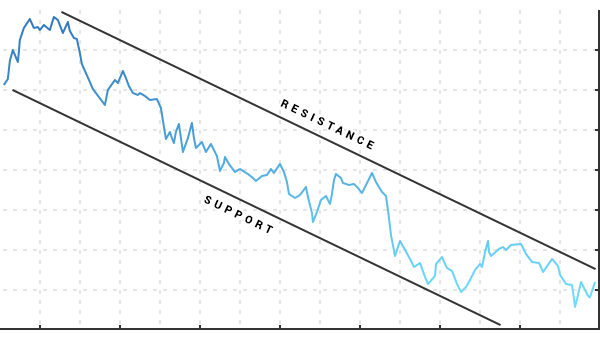
The price movement through the resistance level is called an upward breakout.
Its opposite downward movement is called a downward break-a price movement through the support level. Both of these breakthroughs are accompanied by increased volatility.
To determine the support and resistance levels you can simply mark the levels where the price has risen or fallen in the past.
A variety of technical indicators (ie Fibonacci or pivot points) can determine and automatically draw levels on the chart.
Learn more about Support and Resistance
Chart Patterns
The chart pattern is a unique pattern that predicts future price movements or creates a buy or sell signal.
The theory behind it is based on the assumption that a specific pattern previously observed indicates the future direction of the price.
1. Head and shoulders
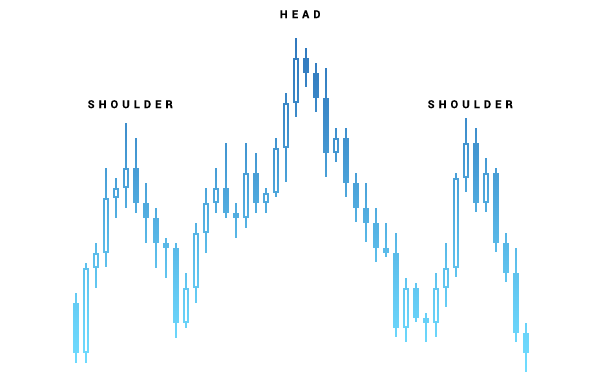
Head and shoulders are considered to be the most reliable chart type, which indicates that a trend is about to change.
There are two types of this pattern-head and shoulders top, which shows that the upward movement may end soon, and head and shoulders bottom, which means that the downward trend is about to reverse.
2. Doji
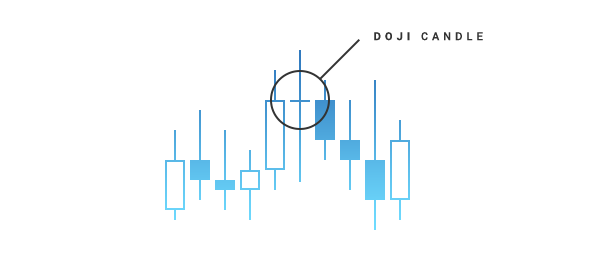
Doji is a form with only upper and lower shadows and no K-line entities (which means that the opening price is the same as the closing price) and the relatively long wick on each side shows market fluctuations over a period of time.
Doji often means that the market is hesitant, because it is neither bullish nor bearish, and the long-short force temporarily reaches equilibrium.
3. Bullish hammer
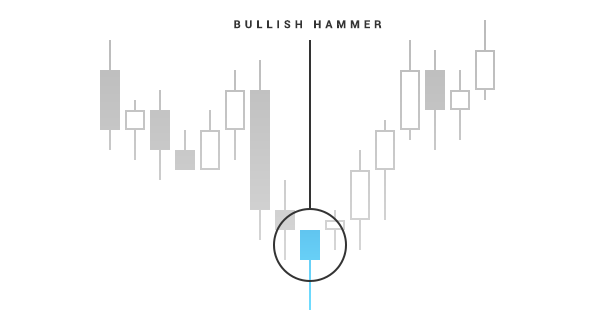
Usually occurs at the candlestick of a downtrend reversal. Its shadow is twice as long as the entity.
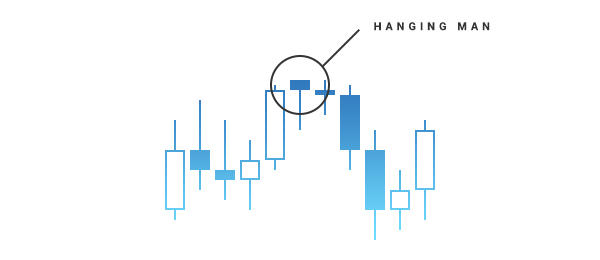
4. Hanging line
A bearish trend opposite to the bullish hammer line, with a shorter body and an extra-long lower shadow line, and appears before the reversal of the uptrend.
5. Triangle
Another popular chart pattern is the triangle.
There are three types of triangles: symmetrical triangles, ascending triangles and descending triangles.
An asymmetrical triangle has two trend lines.
For example, from the perspective of price changes, the upper edge is a downward sloping line, and the lower edge is an upward sloping line.
The short-term high and low points are connected by a straight line to form it. Asymmetrical triangle and both of these trends are fluctuating rather than flat.
This pattern usually has determined the direction of the current trend.
In an ascending triangle, the upper trend line is flat, while the lower trend line is upward.
This pattern is considered bullish and can predict an upward breakthrough.
The descending triangle has the lower trend line that is flat, while the upper trend line is falling.
A descending triangle is a descending pattern that marks an upcoming downward break.
Technical Indicators
One of the tools that allow to predict or confirm trends, patterns, support and resistance levels or buy and sell signals is a technical indicator.
It is a software developed specifically for your trading platform that makes calculations based on price movements and volatility.
Both cTrader and MT4 have a wide range of readily available indicators, however, you can always download a custom one or even create it yourself.
Simply adding an indicator to a price chart may greatly extend your understanding of the current market situation and help to decide in which direction you should be trading.
For instance, to identify support and resistance levels, such indicators as Fibonacci or Pivot Points may come in handy.
Momentum indicator will help you to measure the rate of price change and Zig Zag can be used to predict when the trend will be more likely to reverse.
To learn more on how indicators can be installed and customized, please check instructions for MT4 or cTrader in OctaFX”s Manuals section.
Open OctaFX’s Live or Demo Trading Account
Please check OctaFX official website or contact the customer support with regard to the latest information and more accurate details.
OctaFX official website is here.
Please click "Introduction of OctaFX", if you want to know the details and the company information of OctaFX.


 IronFX

FXGT Broker Review: A Leader in High Leverage Forex and Cryptocurrency Trading
Comment by whatisgoingonTRUMP
February 17, 2025
Trump’s team holds 80% of the $TRUMP token supply, giving them the power to influence prices and put investors at risk. A crypto controlled by one group? Doesn’t seem very decen...