How to use and calculate pivot points?
Pivot points are parallel support and resistance lines that are placed on the price chart to facilitate chart calculations and plots.
Some platforms support pivot points, but if you are using a non-supported platform, you can manually calculate and plot on the chart.
Trade with Pivot Points on FXPro
How to calculate the pivot point
The pivot level is calculated using three types of information (high, low and close) from the previous trading day. There are several ways to calculate the pivot point, but the most common is the five-point system.
The system uses a total of 5 support and resistance lines in addition to the previous day’s highs, lows, and closes to calculate pivot points. The calculation formula is as follows.
R2 = P + (H –L) = P + (R1 –S1)
R1 = (P x 2) –L
P = (H + L + C) / 3
S1 = (P x 2) –H
S2 = P- (H –L) = P-(R1 –S1)
Here, it is defined as follows.
H = High
L = Low
C = Close
S1 = Support 1 – (Pivot Point x 2) – Previous
Day High S2 = Support 2 – Pivot Point – (Previous Day High – Previous Day Low)
R1 = Resistance 1 – (Pivot) Point x 2) – Previous day high
R2 = Resistance 2 – Pivot point + (previous day high – previous day low)
P = Pivot point – (previous day high + previous day close + previous day low) / 3
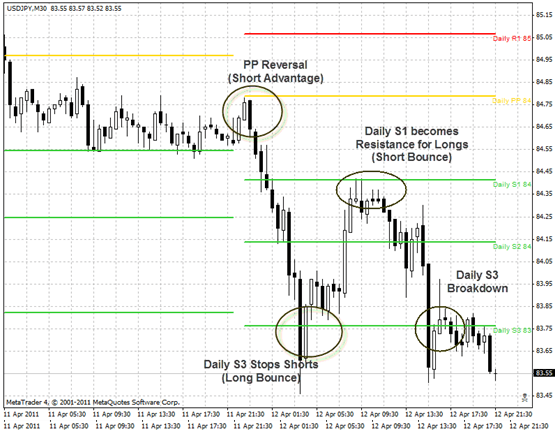
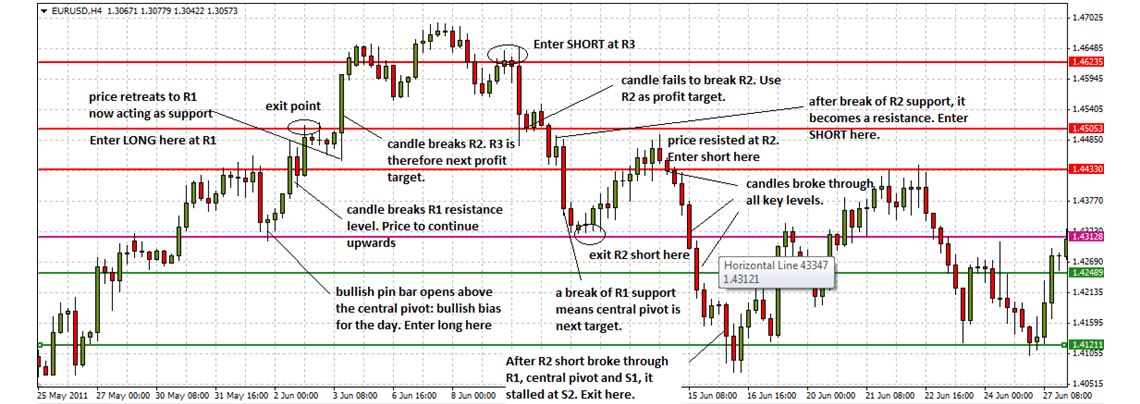
Pivot points, R1 and S1, are the most important pivot levels, but R2 and S2 can also be calculated. Therefore, the chart will show 5 parallel lines (R1, R2, pivot points, S1, S2).
Trade with Pivot Points on FXPro
Plot point trading method

Each day’s highs, lows and closes in a 24-hour market like the fx market are calculated based on the previous day’s price by checking the candlesticks of the previous day. This is usually based on the end time of New York in a 24-hour cycle before the next candlestick opens.
So, for example, if you trade on November 28th, you need to check the candlesticks on November 27th to know the highs, lows and closes.
You can also plot pivot points at shorter intervals, such as an hour or five-minute chart. Pivot levels indicate when and how prices are reversing and turning.
The following example is a 5-minute chart with the pivot level calculated and plotted, plotting the pivot level with reference to the November 27 highs, lows and closes. Therefore, the highs, lows, and closes on November 28 are as follows:
High = 1.4787
Low = 1.4737
Closing = 1.4787
Here is the pivot point calculated based on the above formula.
R2 = 1.4820
R1 = 1.4804
Pivot point = 1.4770
S1 = 1.4754
S2 = 1.4720
However, like other indicators, pivot points do not guarantee 100% accuracy and may not work at all. However, as I explained earlier, even if the trading system is not based on pivot points, it is better to display it on the chart. These indicate the level at which the price reacts during the day.
Trade with Pivot Points on FXPro
Posted by FXBonus
Please check FXPro official website or contact the customer support with regard to the latest information and more accurate details.
FXPro official website is here.
Please click "Introduction of FXPro", if you want to know the details and the company information of FXPro.