KDJ indicator, also known as a stochastic indicator. As one of the representatives of oscillators, stochastic indicators are widely used. And this indicator is not just looking at the golden cross, overbought and oversold, we can see more information based on its subtle changes. The stochastic indicator, because the complete form is composed of 3 lines, namely K line, D line and J line, it is also called KDJ indicator. As one of the oscillating indicators, the stochastic indicator mainly provides related prompts for the short-term long-short sentiment of the disk and has the function of prompting overbought and oversold. And because the indicator has more than one line, it will be more stable than the RSI indicator mentioned by the author in the reminder of mood changes. Therefore, the author prefers stochastic indicators when prompted to enter the market. However, notice that the stochastic indicator on the foreign exchange platform is a bit different, that is, there are only 2 lines. Is this still a stochastic indicator? The author can say for sure, yes. Simplified stochastic indicators are often used on foreign exchange platforms, that is, there are only K-line and D-line, so the author generally refers to it as KD indicator (the name is used hereafter). Because the foreign exchange market runs faster, removing the J line can increase the sensitivity of the indicator, but there is no obvious change in the basic usage method. Note here: The method of inserting this indicator on MT4 requires selecting “Stochastic Oscillator” in “Oscillators”. Regarding the parameters, the foreign exchange platform defaults to (5,3,3), but the author personally thinks that the indicators under this set of parameters are too sensitive and there are too many false signals, so I use (8,5,3) more, as shown in Figure 2.
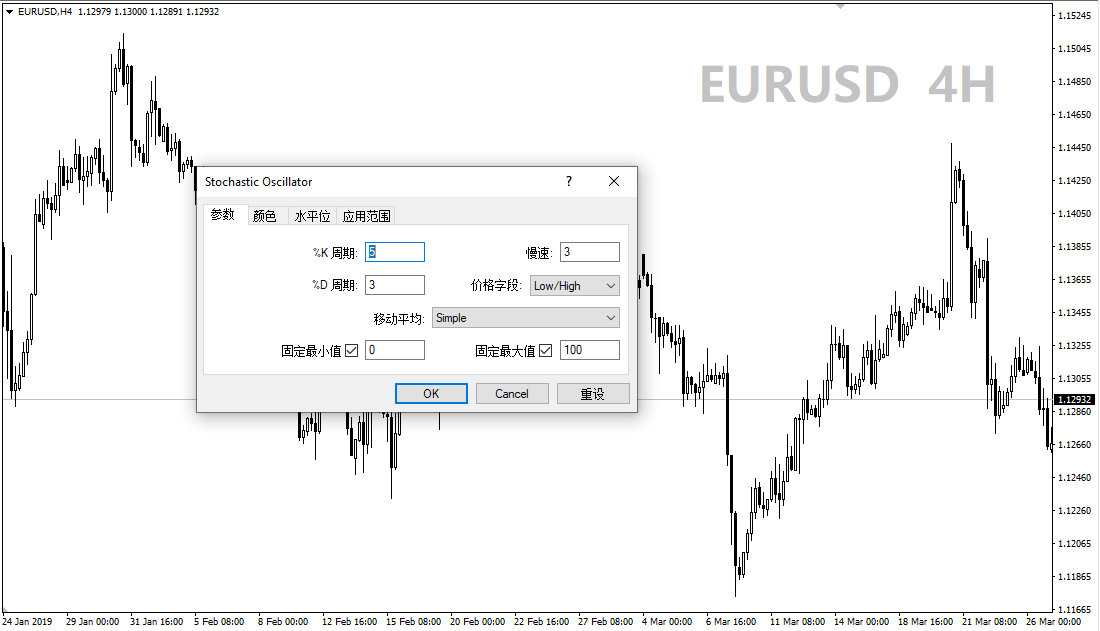
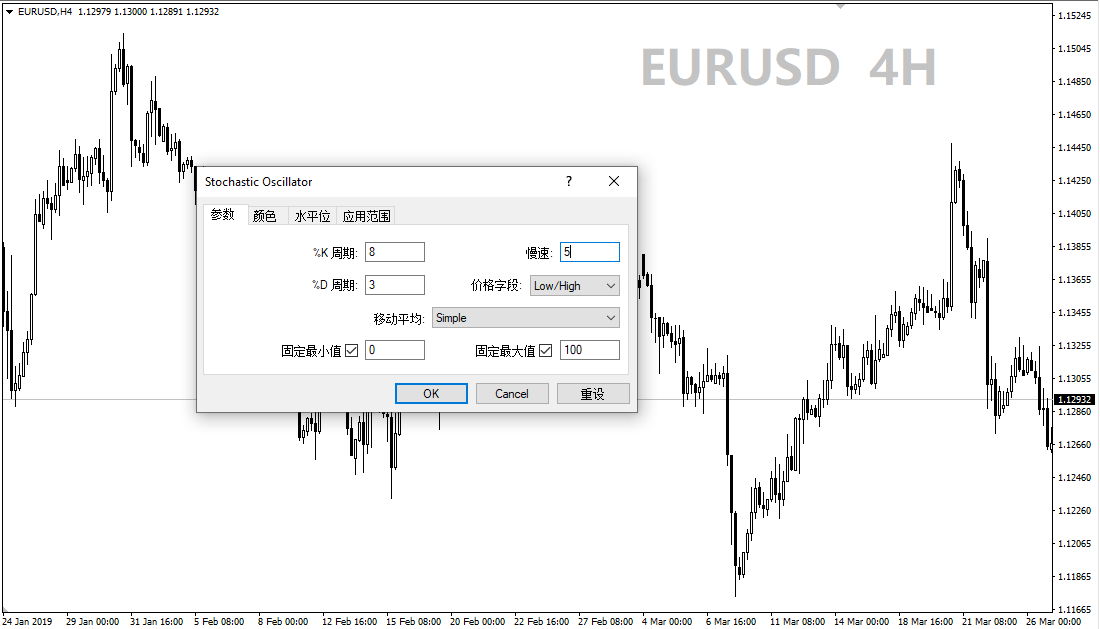
Figure 2 As of April 17, 2019 ONADA MT4 (8,5,3) below, the signal is more stable than (5,3,3), and the sensitivity is also appropriate. The method of using KD indicator is not complicated. First see the interval division of this indicator: (0-20), (20-80), (80-100), the first and third are oversold and overbought areas respectively, the author calls the second one Normal interval. Please note that the indicator entering the overbought zone and the oversold zone does not mean sending a short or long signal, but needs to match the direction of the indicator. For example, in the overbought zone, the KD indicator is still moving upwards. At this time, the disk is often accompanied by continued upwards, and it is not suitable for direct short selling. You need to wait for the KD indicator to close the dead fork and then change its direction before considering the opportunity to enter the market. (The solid line in the above figure is the K line, the dashed line is the D line, the K line through the D line is a dead cross, and the K line through the D line is a golden cross).
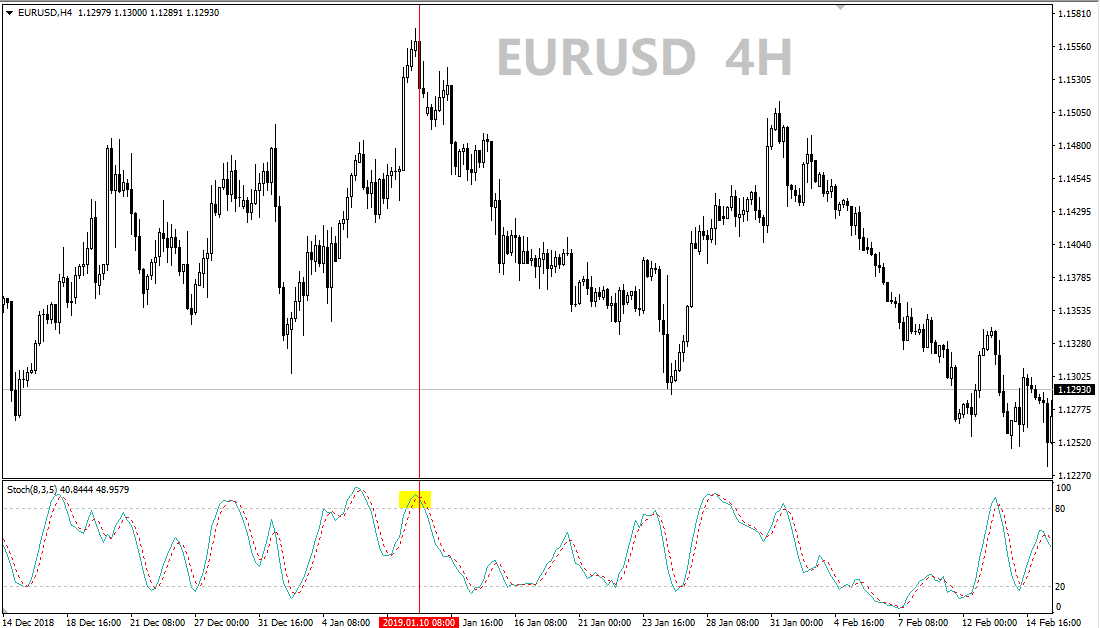
Figure 3 as of April 17, 2019, On ONADA MT4. Generally speaking, while observing the range of the indicator, it is necessary to look at the direction or shape of the indicator. The KD indicator moves up, which means that the short-term bulls are exerting force, and the disk tends to rise accordingly. And KD moves down, which means that short-term strength is exerting force, and the disk tends to fall with it. This one will not be different because of the different intervals. It’s just that our corresponding processing methods are different. The KD indicator moves up in the overbought zone, which often means that although the disk is in an uptrend position, it is likely to fall back in a short time. This is more dangerous to continue to follow the long position. On the contrary, it is the same when moving down in the oversold zone. Therefore, generally, we avoid the overbought zone and go long, and go short with the oversold zone. From a practical point of view, we do not have to look at the golden fork or the dead fork of the KD indicator when we go long and short. The author said that when considering going long, the KD indicator can move up within the normal range. The KD indicator can also move down in the normal range, but the difference is that the position may be relatively less precise.
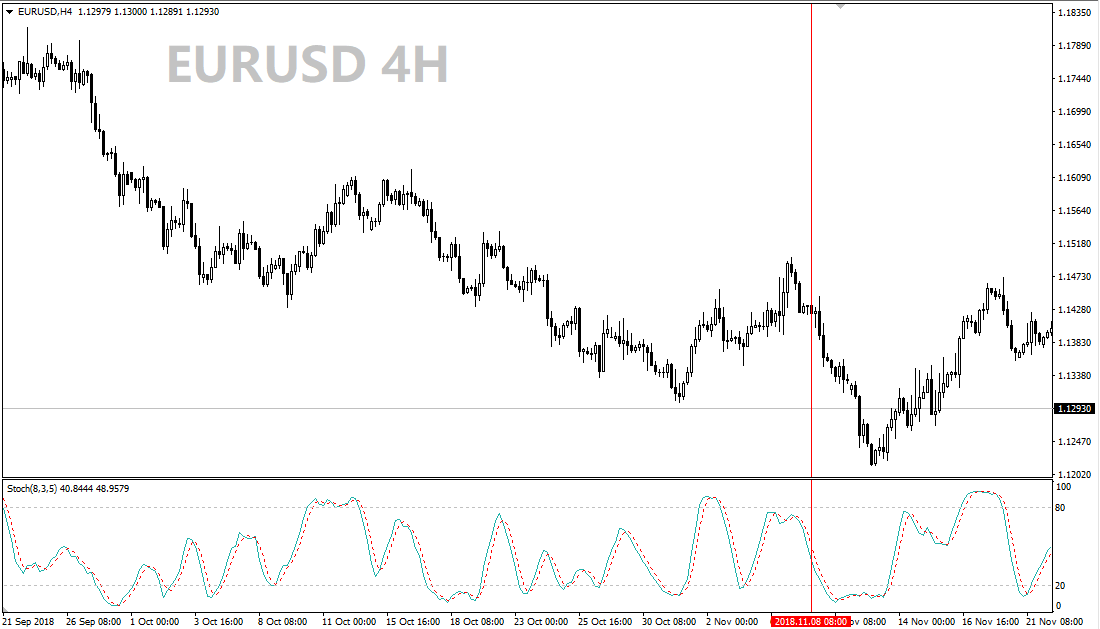
Figure 4 As of April 17, 2019 ONADA MT4. In other words, when the KD indicator moves up, don’t be anxious to go short, and when the KD indicator moves down, don’t be anxious to go long. In addition, what does the KDJ indicator mean if it is horizontal? It depends on where you are. The level point in the overbought zone, also known as passivation, indicates that the bulls are strong and the disk will continue to rise in a short period of time. Although the callback pressure is great, radical friends may find opportunities for short-term breakthroughs in the middle, and at this time It is impossible to go short directly because the KD indicator can no longer accurately indicate the timing of emotional conversion at this time. The same is true for the KD indicator level pointing in the oversold zone. And if the KD indicator points horizontally within the normal range, or fluctuates in the small area, it means that the disk is consolidating and remains on the sidelines for the time being.
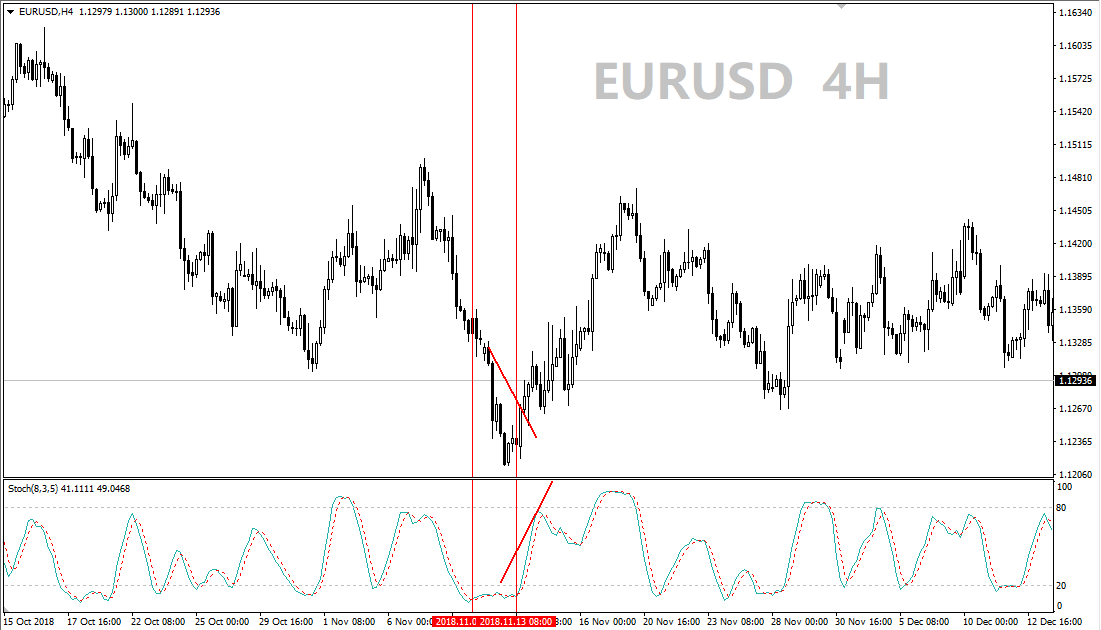
Figure 5 As of April 17, 2019, in addition to the above routine operations on ONADA MT4, there are actually some details that you can also pay attention to. For example, if the KD indicator is not passivated in the overbought zone, but continues to not enter the oversold zone, it also means that the bulls are strong. If the KDJ indicator continues to not enter the overbought zone and the oversold zone, it also indicates that the long and short forces are not strong enough, and the disk tends to fluctuate in a range. For another example, the upward movement of the KD indicator is not smooth, but slightly twists and turns, which means that the bulls are not strong enough. Even if the board moves on the market, the rise is slower.
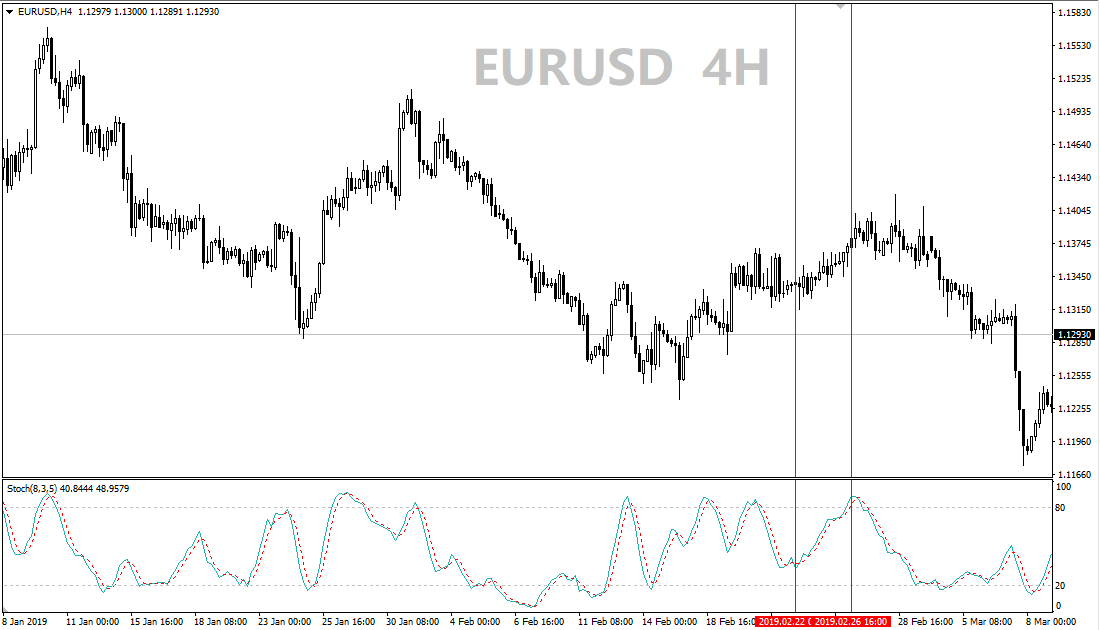
Figure 6 As of April 17, 2019, ONADA MT4 is summarized and summarized. After observation, the KD indicator can indicate the timing of long and short emotional changes in a short period of time, and which force is exerting force, so it can better prompt the callback Single chance. But there is nothing that can be done to confirm the trend, nor can it prompt the RSI indicator as to which power is dominant. In the process of use, it is necessary to use other methods to judge the disk trend and K-line form. In short, this indicator is suitable for short-term intraday trading and can also be used as an appearance consideration.


