The Bollinger Bands indicator remains the most popular tool for assessing the direction and dynamics of a trend, and its trading signals are traditionally highly reliable. Trading strategies based on it are constantly evolving and work successfully on any asset.
How to use Bollinger Bands indicator?
The trading ideas of the John Bollinger indicator are based on real statistics: the price of a financial asset spends more than 70% of all trading time in the range of two, and more than 90% in the range of three standard deviations. This allows the creation of stable trend-following trading systems with a low level of risk.
The Bollinger bands indicator (hereinafter – BB) is a dynamic trend channel of three lines, where the central simple SMA with the period specified in the settings, and the upper (+) and lower (-) channel boundaries are shifted vertically by the amount of statistical deviation from the average value. The shift parameter is the time shift of the channel by a certain number of bars to the future (+) or to the past (-), as well as the type of price for calculation (choosing the Data parameter) allows you to build such a channel on any other indicator.
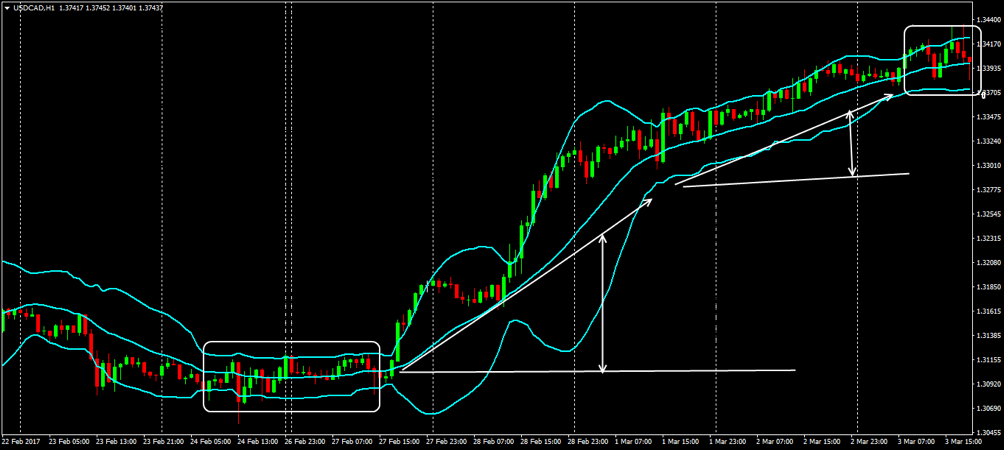
With any parameters, the central line of the Bollinger Band clearly follows the trend, and the borders work as dynamic support/resistance levels. All trading strategies on BB use breakout/pullback situations from these power lines, and with a sufficiently wide channel, you can buy from the lower border and sell from the upper one with trading targets on the central line.
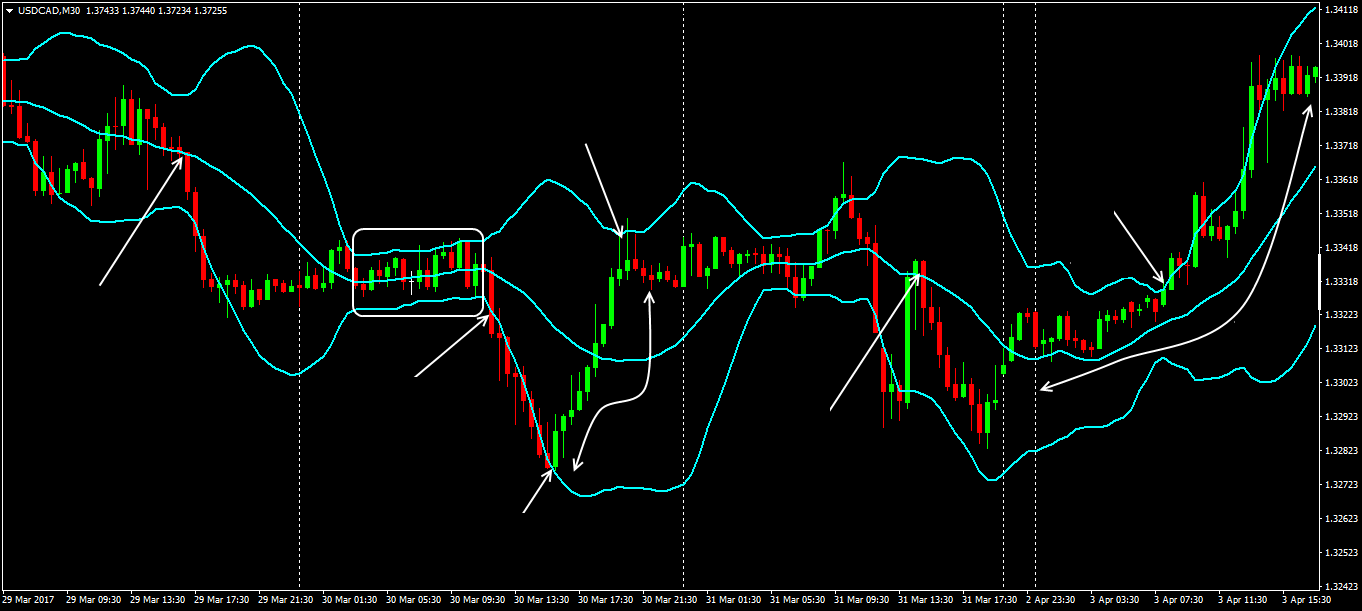
Like any trend indicator, for reliability, Bollinger Bands in a strategy require confirmation of their signals. The shorter the timeframe on which a trading decision will be made, the more additional filters are needed to filter out false signals. Let’s consider several examples of strategies using the famous indicator.
Analysis of the trend at different periods
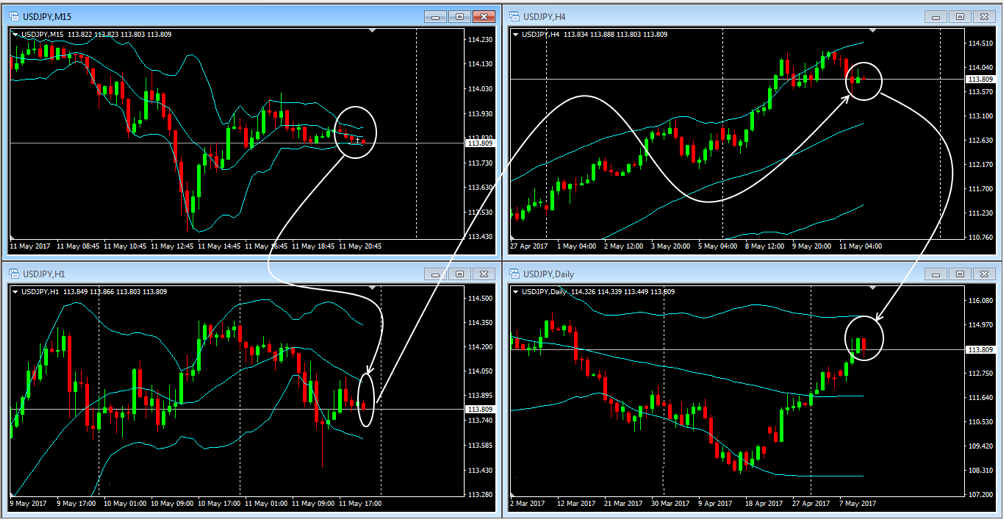
BB trading signals are analyzed on a combination of a small (“working”) and a larger timeframe: M5-M15; M30-H1; H4-D1; W1-MN1. At the junior period, we look for an entry point and monitor the position; at the senior period, we perform a general analysis of the situation so as not to miss the moment of the trend reversal. This allows you to hold the deal until, at least, the medium-term trend has been fully worked out.
Most often, the market entry is carried out according to the volatility breakout scheme, that is, above/below the channel boundaries, a bunch of pending BuyStop / SellStop orders is located. The direction of the breakout does not really matter, since there is enough of a narrow flat, there is an accumulation of trading interest (most often – from both sides), and a breakout will be necessary.
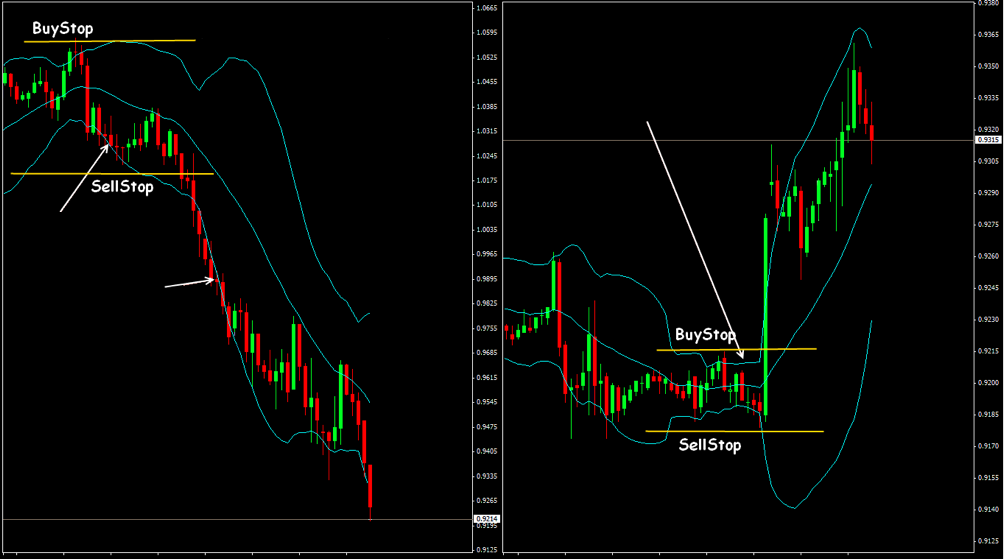
In the traditional version of such a system, other indicators are not used, but it is still recommended to confirm the entry point with additional methods – at the discretion of the trader.
Trading on the rebound from the channel boundaries
Trading asset: any currency pair with stable volatility. Timeframe: not lower than H1. Indicators: BB, RSI, Stochastic. We build several Bollinger Bands with the same period, but with different deviations. It is understood that the situation when the price leaves the channel for a long time with a standard deviation of 3 is extremely unlikely, much more often the price either reverses or slows down after entering the zone between the channel boundaries.
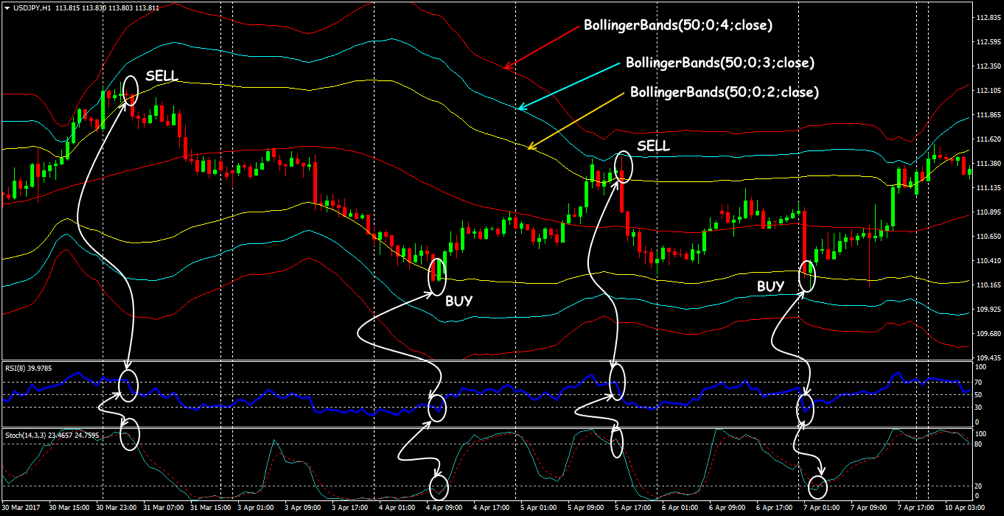
Using Bollinger Bands, the strategy makes a reversal entry from the key zones – on the second candle, but for reliability, the signal is confirmed by the corresponding behavior of the oscillators. The first target is the middle of the channel (with trailing we fix about 60% of the transaction volume), we leave 40% of the volume in the expectation that the price will still reach the opposite border.
BB, Envelopes and ParabolicSAR Bundle
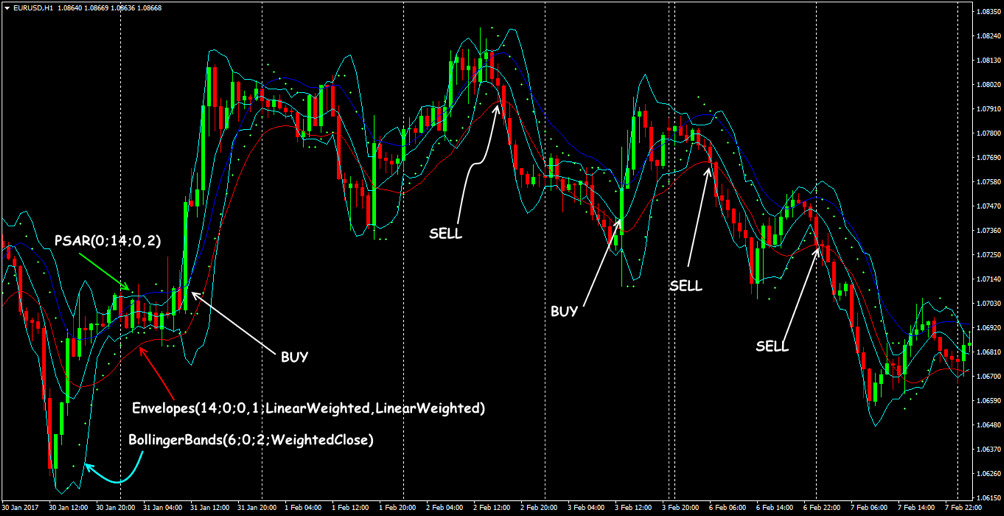
Trading asset: EUR / USD, GBP / USD, USD / JPY. Timeframe: H1 and higher. The deal is concluded at the point where the Bollinger line goes beyond the Envelope; the direction is determined by Parabolic (points below the price for a long position, above the price for a short position). StopLoss is below the red Envelopes line when buying and above the blue line when selling.
BB, RSI and MACD kit
Trading asset: any, including stocks and futures. Timeframe: H4. The BB indicator is based on the RSI values (in the settings – apply to “First indicator data”).
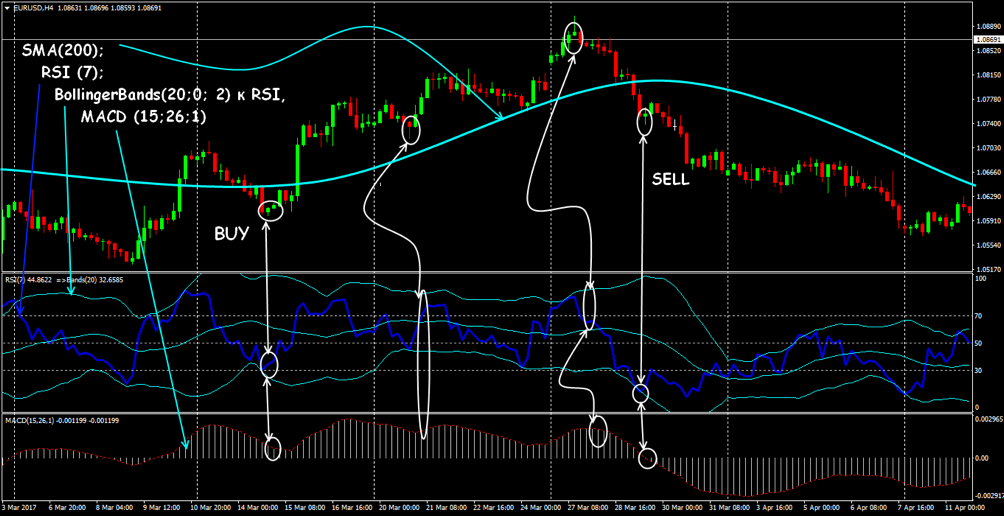
The moving average, in this case, determines the global trend and is used to fix losses until the StopLoss. To buy: RSI is below the lower boundary of the BB; MACD is above 0; for sale – reverse conditions. We enter on the pullback of the RSI line back to the channel.
BB, RSI and ADX Kit
Trading asset: major currencies, indices, underlying futures. Timeframe: M5 and higher.
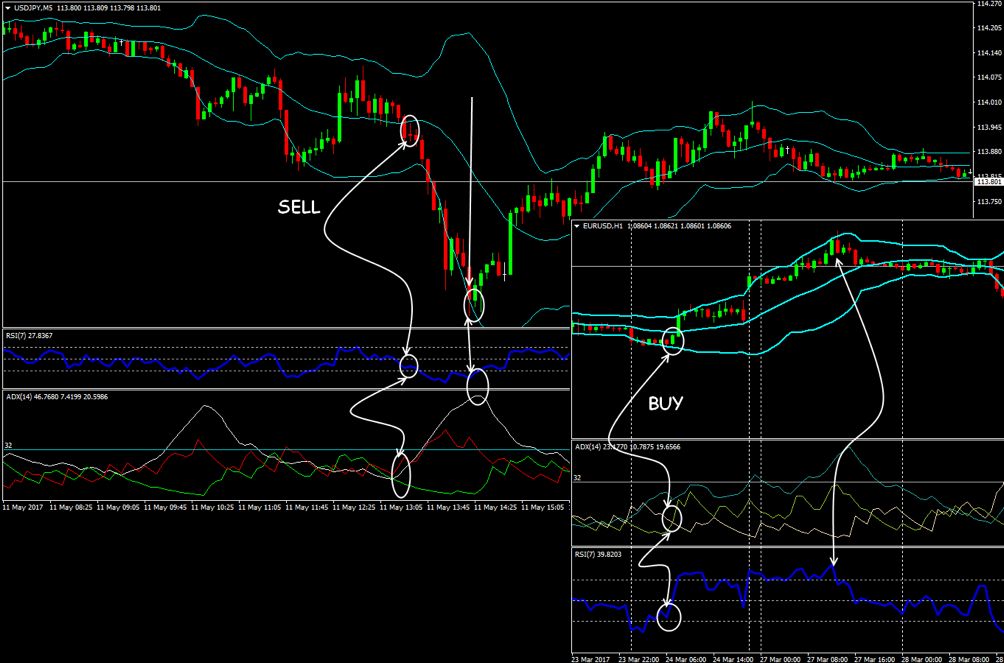
Entry conditions: price outside the Bollinger Bands (above the top – sell; below the bottom – buy); RSI in the critical zone (respectively), ADX readings – no more than 32. StopLoss level – at the max/min of the entry bar, then – trailing.
Bollinger Band Strategy Summary
The CCI indicator is absolutely unsuitable for trading Bollinger Bands as an oscillator since it is based on the same principle – it measures deviations from MA.
Signals in the direction of the Bollinger Bands breakout are considered more reliable. The holding period of the deal should not exceed four candles, after which it is recommended to partially fix the result.
Pending orders should be located at a reasonable distance from the borders so that there is no false triggering during the period of speculative stop-loss immediately after the breakout. The working order should be triggered in the strongest direction and then follow the trend before reversing.
The main drawback of the indicator is lagging, so it is recommended to work on periods of at least M30. A fixed take profit is unprofitable as the BB indicator “slides” behind the price. Or trailing, or we regularly move the stop manually.
We apply all strategies only during periods of stable activity: before, after, and during the news – we do not trade.
The Forex Bollinger Bands indicator is based on the calculation of the average value, therefore, all manifestations of speculative volatility sharply reduce the accuracy of the signals. In this regard, such trading schemes are recommended for traders who prefer stable profits in a calm market, rather than running after quick but unreliable profits.


