There are many mysteries in the simple moving average, and it has derived countless uses since its invention. The reason why it is so popular lies in its intuitive and clear thinking and simple and easy-to-understand principles. Today we will explain the basic principles and various methods of using moving averages from the shallower to the deeper.
The composition of the moving average is very simple. We take an average of the prices in the past period of time, and then connect them to form the moving average. Here, most of the time we use the closing price as a reference basis, but sometimes it may be better to use the opening price. We will explain to you when to use the opening price later.
Assuming that the closing price of a certain product in the 5 trading days from No. 1 to No. 5 is 1.2, 1.3, 1.4, 1.5, and 1.6 respectively, then the position of the 5-day moving average at this time is around 1.4 (the calculation method is (1.2 +1.3+1.4+1.5+1.6)/5=1.4) nearby. The closing prices from No. 2 to No. 8 are 1.3, 1.4, 1.5, 1.6, and 1.7 respectively. The 5-day moving average at this time is around 1.5, and so on, when we get this series of averages After the price position, connect these average prices to get a curve, this curve is the moving average.
After understanding the composition of the moving average, we can understand one of the most basic and important principles behind the moving average theory: cost theory: when the moving average rises, it means that the daily closing price in the market is gradually rising, and the market holds a certain The cost price of investors in a trading day is also gradually rising. At this time, if no accident happens, people are unwilling to sell at a loss, and the price will gradually rise at this time. vice versa.
After understanding the cost principle of moving averages, we can understand many uses of moving averages. For example, when the moving average is up, it indicates that the price is in an upward trend. The opposite is a downward trend. In addition, the golden crosses of the moving averages are also signals that imply short or long entry.
In fact, many usages of moving averages have been summed up by predecessors. The famous Gnanwei Eight Trading Rules is one of them. It divides the usage of moving averages into eight categories, namely: deviation (long and short), do long without breaking the moving average cross, go short without breaking the average cross, go long when the moving average breaks slightly below and go short with a small break through the moving average.
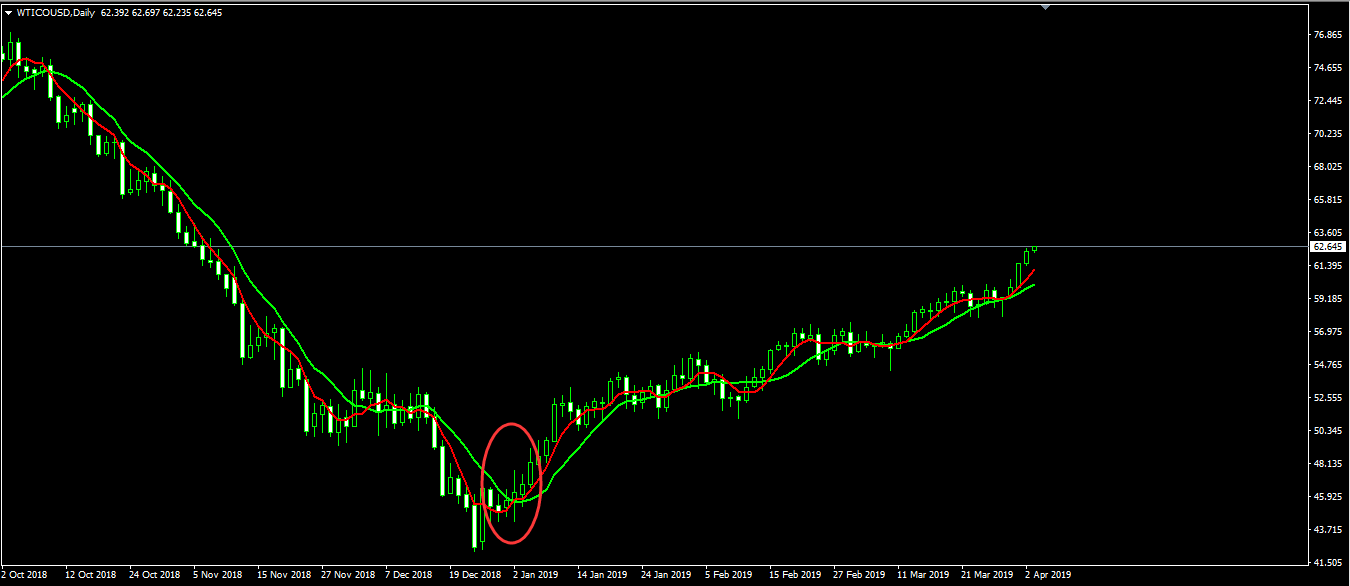
First look at the deviation, the principle of deviation and the principle of cost are very close. Suppose that the price has been closely climbing along with the 10-day moving average recently, but one day the price suddenly rose and came to a place far away from the 10-day moving average. As mentioned earlier, the 10-day moving average represents the holding costs of most investors in the past 10 trading days. As shown in the figure below, the price suddenly rises in the first ellipse area. At this time, the 10-day moving average is still near 48.62, but the highest price is near 53.20. This means that most investors in the market have already seen more floating profits at this time, and their motivation for profit-taking is stronger. Therefore, whenever the price deviates far from the moving average, there is an incentive for the price to move closer to the moving average again.

We can see prices in the second oval area has also appeared in a large deviation, therefore, we can look again at what time the price will be toward The 10-day moving average fell back. But in actual operation, the deviation is not necessarily a signal to go short or long in the opposite direction, because once the trend is formed, it will tend to continue, so our best strategy should be to follow the trend, not to trade in the opposite direction. Therefore, once the price and the moving average deviate too high, we can wait for the price to step back, and then regard the price step back as an opportunity to increase positions.
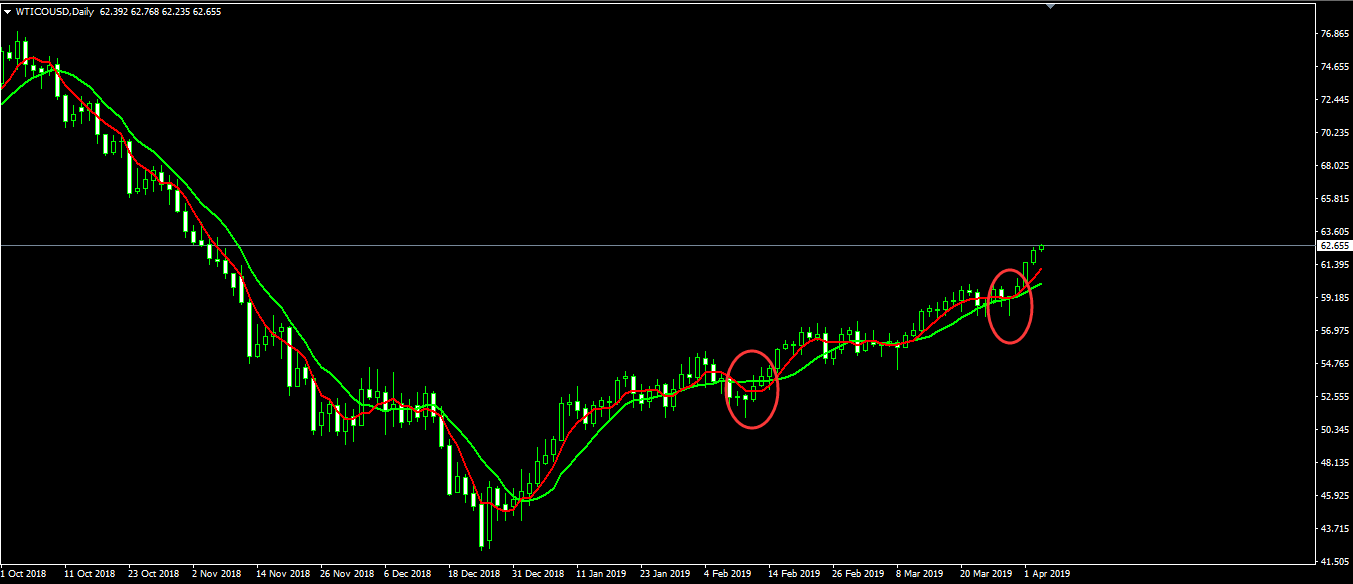
Look at the dead cross and golden cross of moving averages. They are used in combination with a short-term moving average and a long-term moving average (such as 5-day and 10-day moving averages). The so-called dead cross-refers to the short-term moving average falling below the long-term moving average, which often means the price. A period of the downtrend will begin. Conversely, if the 5-day moving average breaks above the 10-day moving average, it means that the price is about to enter a period of upward trend (as shown in Figure 2).
The principle behind Die Cha and Jin Cha is also the cost principle. For example, the 5-day moving average Jin Cha 10-day moving average means that the transaction cost of holding a certain product in the market in the past 5 trading days has exceeded the average of the past 10 trading days Holding cost. At this time, the cost of holding this product is gradually rising. If there is no shock from unexpected factors, then no one is willing to sell it at a lower price.
Then look at the crossovers of the moving averages and the short breaks before going long or short. Not broken here means that the short-term moving average has tested the long-term moving average downward, but it has not broken (the second ellipse area in the figure below). A small break below refers to the short-term moving average falling below the long-term moving average and then turning upwards (the first elliptical area in the figure below). The principles of these two situations are basically the same as the principle of the golden cross, and there will be no more here.
Finally, note that we are looking at moving average and MACD Sicha, when, or when not in the judgment below and below, it is necessary to wait until the MACD / It can only be confirmed after the K-line corresponding to the dead fork/breakdown is closed. Because, when we use the closing price as the basis for calculating the moving average, the closing price will always be based on the latest price, and the closing price at this time will always change. It is possible that we saw that the Golden Cha had succeeded in the last second, but the next second when the price broke through and fell sharply, the moving average would immediately fall again, and the Golden Cha disappeared at this time. Therefore, we must wait until the K-line corresponding to the moving average Jin Cha / Si Cha closes before making a decision, or in other words, we can simply use the opening price as the basis for calculating the moving average.
Finally, on the choice of two moving averages, it was suggested by a multiple of 7, because 7 represents a week, just a small period. But the author recommends choosing a multiple of 5, because in crude oil, gold and foreign exchange futures trading, there are 5 trading days a week, and 5 represents a small cycle.