
“Technical Analysis” to predict future prices
An approach to trading that solely relies on the historical research of price movements is defined as Technical Analysis.
Through the analysis of price movements a trader or investor aims to identify key price patterns, important price points and other important relationships.
It is through the correct application of technical analysis that a trader or investor can make assumptions and predictions on the possible future price action.
Expert Advisers are based on Technical Analysis
It is known that more than 80% of manual traders lose their first investment fund. So what are the other 20%?
Now there are millions of trading programs invented by investors aiming to earn more stable profits.
For the most popular trading platform in the world, MetaTrader4, the trading programs are called “Expert Advisers”.
And these Expert Advisers are created based on technical indicators.
By analyzing the Forex market with technical indicators, you can create a trading robot that will generate profits continuously in your trading account.
You can also analyze the market by yourself, and there is a number of technical indicators that you can use.
Let’s see what kind of technical analysis is used by traders.
3 Basic Forex Price Charts and Different Merits
Charts have become a major component and tool in the study of technical analysis.
A chart is a graphical representation of the price action.
Charts are useful to traders as they give the price action a visual order that is easier to interpret.
Further visual representation allows a trader to identify relationships between certain price points through the application of trend lines, horizontal support and resistance levels, moving average and more complicated market studies such as Stochastics’, Bollinger Bands, MACD and RSI.
The major chart types are the following:
- Candlestick Charts
- Bar Charts
- Line Chart
All chart options allow traders to choose a range of standard time frames from 1 minute to monthly.
The Metatrader4 hart package also allows traders to further customize their charts by choosing different colour schemes and back ground designs.
Line Chart
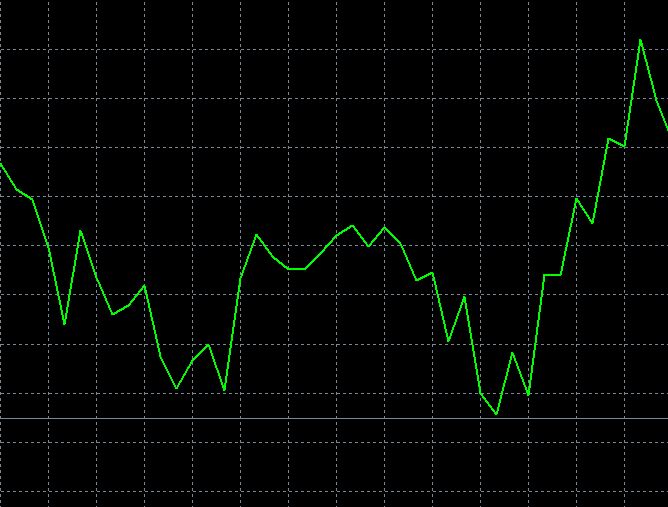
Also known as Line on Close is probably one of the least used method of chart types.
The reason for is that its graphical representation of the price action as a sequence of closing prices gives the least information.
However this very simplicity does give it a big advantage over other chart types.
This being that the lack of noise that a Line chart produces takes away some of the psychological pressure a trader or investor experiences.
Furthermore this simple graphical representation does make it much easier for the eye to identify price patterns which could be lost in the noise of other chart types.
Bar Chart
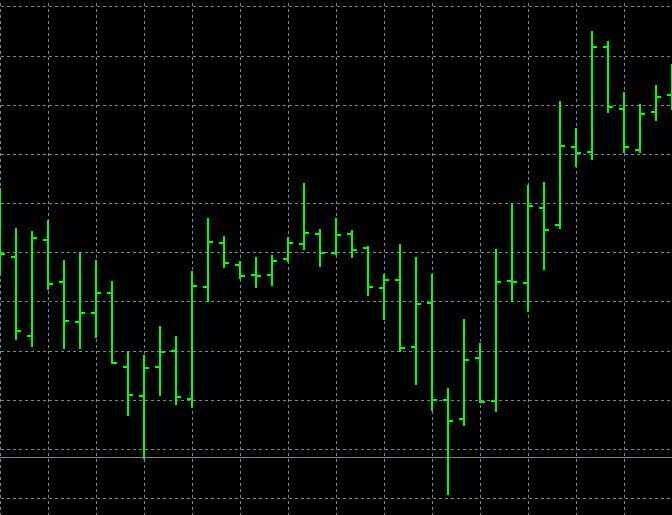
Bar Charts have been popular for many years within the West and as such are the second popular chart type in use.
A Bar Chart gives a trader four important price points over a specific period of time.
These being the open, high, low and close.
Traders and investors look at the structures created by bar chart patterns for a means to predict the future direction of prices.
Candlestick Chart
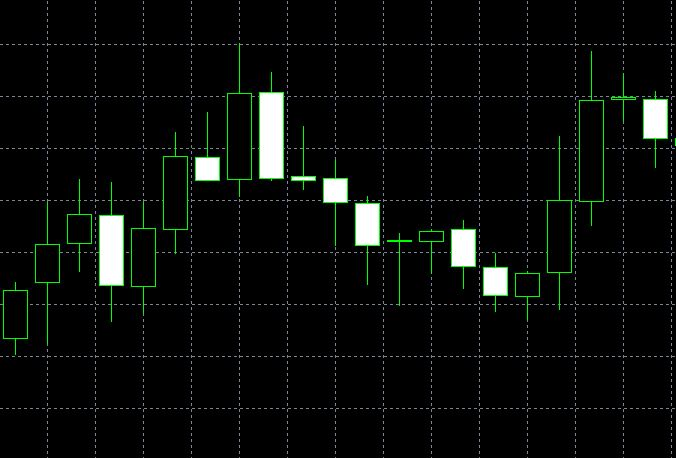
Candlestick Charts are by far the most popular chart study.
Although very similar to Bar Charts, Candlesticks give a trader an additional visual clue on how the last period closed.
It does this by creating what is called a body between the opening and closing price.
If the closing price posted a higher value than the opening price for the period the body will be shaded green.
If conversely the closing price posted a value that is lower than the opening price the body will be shaded red.
The prices that fall outside the candle body are called the wicks.
The top of the wick represents the highest price the instrument traded to during a predetermined time scale and the bottom of the wick being the lowest price.
“Support & Resistance” How to Setup
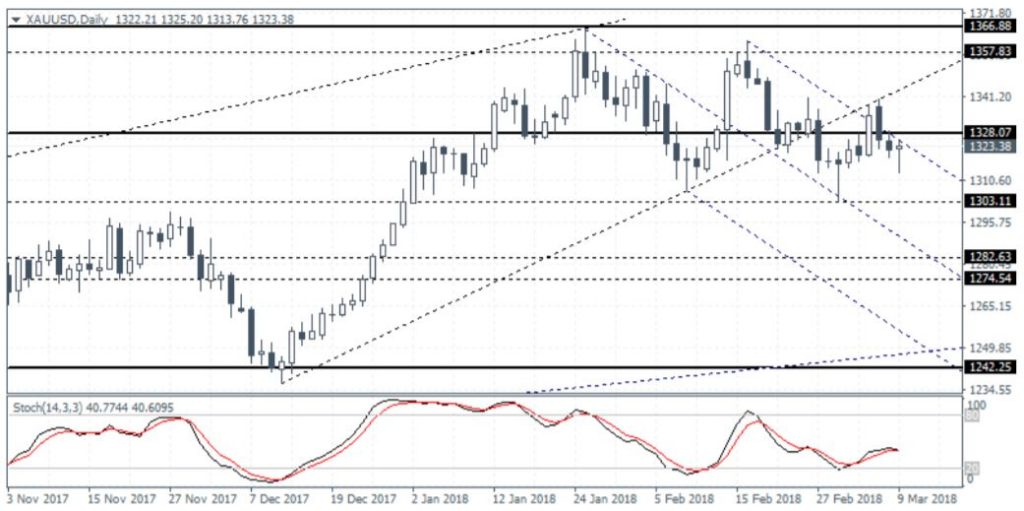
There are “Support Lines” and “Resistance Lines” in each price chart.
These are the two very important technical indicators though, how they are used and how they are analyzed?
Imagine an investor stood in the middle of an alley surrounded by tall brick walls.
If one was to throw a tennis ball at one of the walls with sufficient power it would not be a surprising if the ball was to bounce back and forth between each wall.
In this case the two walls offer a solid boundary that repels the tennis ball.
On a chart, support and resistance have a similar effect to price action.
In this case however, instead of two horizontal walls a trader will look for an area to place a price floor and and a price ceiling.
Support and resistance both act as boundaries against the current price level.
Support being the boundary floor and resistance being the boundary ceiling.
Unlike two solid brick walls horizontal support and resistance act as areas where the price may struggle to trade above or beneath.
Traders tend to observe the price action around the key support and resistance levels.
They want to examine whether the price action can sustain a move and therefore close above or below these key levels; or whether the price action be pulled back into the prior range.
By understanding the relationship of support and resistance levels to the current price structure, a trader is able to make informed decisions and plan their trading.
A trader could for instance create a plan where they buy at support or sells at resistance.
Alternatively a trader may create a plan which buys breakouts above resistance and sells break downs beneath support.
What time frame of chart is recommended?
This is a question which is depended on how much time an investor has available to trade.
A short term trader could choose 1, 5, 15 and 30 minute time frames from ultra-fast tick charts.
Whereas longer term traders could decide to concentrate on 1 hour, 4 hour, Daily, Weekly and Monthly times frames.
Many traders choose to adopt a top down approach.
This approach allows, through the implementation of multiple time frame analysis, the trader to choose one or two time frames to ascertain the most likely direction for future price action.
The entry and stop targets are then taken off a lower time frame.
Popular techniques, amongst others, would be the adoption of a daily and 4 hour time frame, a 4 hour and 1 hour or a 1 hour and 5 minute time frame.
The possibilities and options are numerous and can be customized to an investors individual trading style, risk appetite and time they have available to trade.
“Trend Lines” is the Basic of Forex Technical Analysis
If a trader studies a chart long enough, they will notice that price action tends to rise and fall along a consistent line.
An uptrend can be defined as a series of higher highs and higher lows, there is a certain degree of predictability to identifying key turning points that the price action will follow.
The same can be said of a down trend.
When the price action is trending lower a trader would expect to see a series of lower lows and lower highs.
Once again a trader could probably gauge by eye when a corrective rally will lose its momentum and begin to move back in the direction of the dominant trend.
Know the Trend, Know the Market
The flow of market action during the trend cycle can be defined by visual means through the use of the most basic yet one of the most effective chart studies.
The trend line
A trend line is a simple process of connecting two swing points during and up trend and then extending this line into the future.
The same process can occur during the down trend, where the investor would connect two consecutive high swings.
In both cases if the price action is trending in one direction then the investor should see a rising trend line that connects rising lows during an uptrend, and a falling trend line that connects lower highs.
Trade by following the Trend
As if by financial alchemy, the investor can now with some predictability work out through visual means, where the price action should naturally pullback to.
This type of price movement is especially useful to swing traders whose aim it is to participate in moves by buying into weakness during an uptrend and selling into strength during a down trend.
Trend lines do not always give investors the exact point of entry on the third pullback
This is because other traders are aware that swing traders will look to add positions at these levels and try to hunt for their stops.
Therefore an investor may see some volatility around the third intersection of price and trend line support, and resistance with a series fake outs and false moves that could keep investor the investor guessing.
Be Careful with the “Trend Break”
A trend line break could also give the investor an early clue that a trend is about to change.
A break beneath an uptrend line can be viewed as bearish if the price action on the first pull back fails to break above or sustain a move above the uptrend line.
Alternatively a break above a down trend line can be viewed as bullish if the price action on the first pull back fails to break beneath or sustains a move below the downtrend line.
The understanding of how a financial instrument reacts to a move to or through a trend line is a difficult task as it requires a detailed understanding of short term price patterns and price exhaustion or continuation analysis.
Investors must also be able to master the correct placement of stops around these levels, to ensure that the market volatility does not prematurely take them out of a profitable trade.
Trading with Technical Indicators and Bull/Bear Positions
For some time now the use of technical indicators has been very popular amongst traders and financial analysts.
The Metatrader4 platform, offers a wide variety of indicators to traders.
Indicators are useful as they enable chart users, through the application of both simple and complicated programs to gain a market view that side steps the perceived complexity of price action analysis.
The use of indicators has both positive and negative aspects.
From a positive view point, the user of this chart functions interpret the price action very quickly and through these tools gather a picture of how the instrument could move over the coming periods.
Furthermore the simplicity of the data outputs allow a trader to build a standardize strategy around these technical indicators.
From a negative aspect these indicators are all derived from price and therefore lagging.
A skilled technical trader who applies pure price action analysis should be quick in entering the trade and nimble in managing the position.
Bull Positions
A bull or long position seeks to profit from rising prices in certain securities.
When prices rise, a bull position becomes profitable.
If prices fall, the bull position is not profitable.
A bull or long position is the most well-known type of position and is what is typically used in “buy and hold” investing.
Bear Positions
A bear position attempts to profit in a market by betting that prices will fall for certain securities.
The short seller borrows securities in the hopes that prices will decline.
When the price drops, the investor makes a profit on the price change.
When the price rises, the investor loses money.