How to apply and trade RSI Support & Resistance?
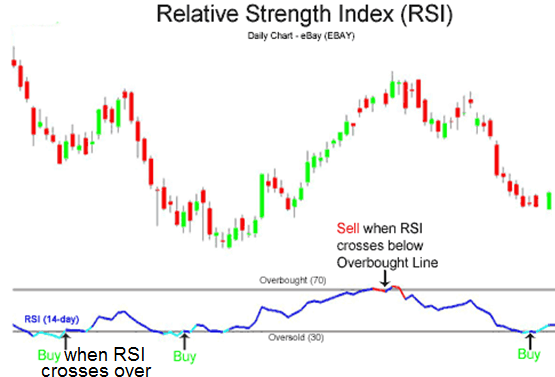
RSI readings are displayed on a scale from 0 to 100, with 70 and above indicating the buy-and-hold zone and 30 and below indicating the sell-and-hold zone.

What distinguishes amateurs from professional traders is the fact that professional traders use a variety of trading strategies to maximize profits and minimize losses. One such strategy is known as the Relative Strength Index (RSI). The RSI method was invented in June 1978 by a US mechanical engineer named J. Welles Wilder.
One of the most important technical indicators on the market, the RSI is calculated based on the volatility and direction of commodity price fluctuations. This means that the RSI index is involved in measuring the potential stock price of a commodity. However, it is important to know that the RSI is an oscillator that not only helps measure the internal strength of a product, but also provides detailed information about the trend based on past trends.
Trade with RSI Support & Resistance
The main benefits of using RSI Support & Resistance
This powerful indicator is used by professional traders around the world for both long-term and short-term trading strategies. Apart from showing buy / sell, RSI signals help traders make decisions and can efficiently determine when traders enter or leave the market based on financial market conditions. They are basically trading signals that give you insight into common price fluctuations / reversals and trends. Based on the data introduced and provided by the introduction of the RSI, traders can make informed trading decisions.

Why the RSI is so popular with traders?

Simply put, professional traders use the RSI for forecasting and alerting purposes.
- Forecast:
- The RSI is used to predict future price movements.
- Alerts:
- The RSI also alerts traders about price movements in general, helping traders make better decisions based on their readings.
Trade with RSI Support & Resistance
Things to keep in mind when using the RSI index
The most common mistake among traders is to ignore price movements of a particular commodity and rely solely on indicators. It is important to know that the RSI index does not directly indicate price movements. Despite being a buy / sell signal, the RSI can be used in conjunction with trend lines and other technical analysis tools to prevent trade signal errors. This is primarily due to the rapid increase in price movements, which can signal false buying and selling, urging traders to make hasty decisions and, as a result, make false decisions.
Trading method using RSI index
RSI is calculated based on the formula below.

RS = Average Profit / Average Loss
The basic structure of RSI is RS, average profit and average loss. As Wilder explains in his own book, RS calculations are mapped in a 14-day cycle, which is set as the default. Losses are considered here as positive value, not negative value.
Calculation 1 – Average Profit and Average Loss in Default 14-Day Cycle:
First average profit = total profit for the last 14 days / 14
First average loss = total P & L for the last 14 days / 14
Calculation 2 Therefore – based on previous average and current profit / loss
Average profit = [(previous average profit) x13 + current profit] / 14
Average loss = [(previous average loss) x13 + current loss] / 14
Using the previous and current values is a simplification system similar to that used in exponential fluctuation average calculations. The RSI value becomes more accurate as the calculation period increases. Sharp charts use at least 250 numbers before the chart start date (assuming a lot of data is present) when calculating RSI values. The formula must have at least 250 numbers to accurately report the RSI number.

What is the Support and Resistance Index?
The price level at which demand is considered to be favorable to prevent further price declines is called support, and the price level at which supply is considered to be favorable to curb price increases is called resistance.
Conclusion
Nowadays, a lot of indicators are made almost every week. However, there is no doubt that the RSI index is considered to be the most reliable and useful index. The RSI index provides traders with a detailed analysis of general market fluctuations, market reversals and trend lines, as well as an outlook for supply and demand balance. However, before trying these indicators, it is advisable to familiarize yourself with their complexity and technique to prevent mistakes and uncalculated movements.
Trade with RSI Support & Resistance
Please check FXPro official website or contact the customer support with regard to the latest information and more accurate details.
FXPro official website is here.
Please click "Introduction of FXPro", if you want to know the details and the company information of FXPro.


