The task of the tools under the general name Stochastic indicator is to catch the beginning of a new trend or reversal in time. Since the development by financier George Lane, many versions have emerged with varying degrees of reliability.
Today, all of them are actively used both as an independent means of technical analysis and as part of combined strategies.
Stochastic indicator description of the main signals
Let us briefly recall the principle of the formation of entry points of the classic Stochastic indicator. The basis for the calculation is the Close / Open prices of the trading range for a fixed time. The first line (% K) shows the ratio of the current Close price to the trading range; the second (% D) is a simple moving average of% K. The range of values is from 0 to 100 (no extreme values), traditionally, critical zones above 80 (overbought) and below 20 (oversold) are distinguished, the level parameters can be changed. Setting the parameters allows you to adjust the noise level in trading signals.
It is understood that the Stochastic indicator generates three types of signals:
intersection of% K and% D lines; the most frequent signal, but not the most reliable.
- Breakdown of% K% D from bottom to top – the beginning of an uptrend – getting ready to buy;
- Breakdown of% K% D from top to bottom – the beginning of a bearish – we are talking about selling.
Movement in the overbought/oversold zone.
- A reversal below the oversold line (20/30/40) generates a buy signal, if the situation is accompanied by the crossing of the slow% D from below – the signal is strengthened;
- The same situation is in the overbought zone (80/70/60) – we plan to sell, if in the zone the% K line breaks through% D – the signal is more reliable.
Divergence of the indicator and price.
- A decrease in the indicator line on an upward price trend means a high probability of a downward reversal – a signal to sell;
- If the indicator forms a new maximum on a downtrend in the price, we wait for the price reversal upward and look for a moment to buy.
Stochastic divergences are rarely used as independent signals. On the indicator lines, standard charting patterns are quite effective, especially, “Double Tops / Bottoms”.
The above trading signals can be used without additional tools, but such stable systems are almost never found. In general, trading strategies using the Forex stochastic indicator can be divided into three groups – see below.
Stochastic + Stochastic
At least two Stochastics with parameters set for different time periods are used. It is understood that the indicators should mutually compensate for the disadvantages: a lot of false signals on small periods and lagging on large ones.
An effective example of such a pair: Stochastic (5,3,3) (30/70 levels) and Stochastic (21,9,9) (20/80 levels):
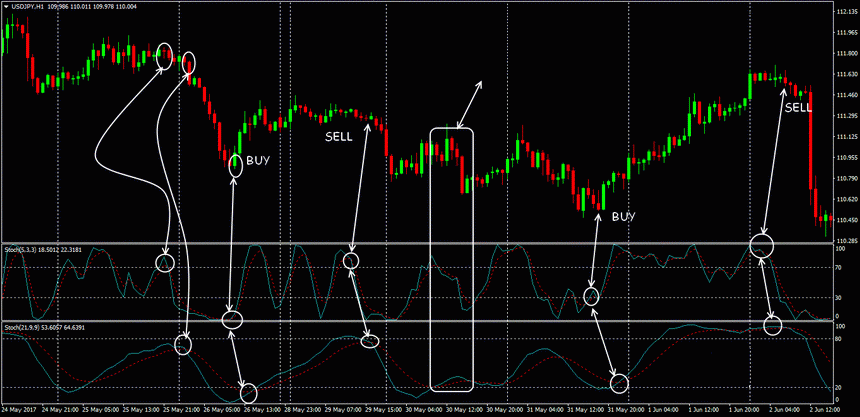
The slow stochastic is considered basic, the fast one is auxiliary. The idea is simple: control of the situation begins from the moment the first signs of a stable trend appear on the market. The appearance of a fast indicator in the critical zone gives the first signal to prepare to open a deal (buy or sell, respectively), and the presence of a point of intersection of the% K and% D lines is a must.Then we wait for similar actions from the base indicator. If the candlestick closes and the signal is still valid, then you can open a deal. StopLoss and TakeProfit – according to the classic rules, but in case of a sharp change in the trend, positions are quickly closed.
Stochastic + Oscillator
The meaning of the strategy is the use of oscillators with different calculation methods, which significantly increases the reliability of the signals. Such schemes work on timeframes of at least H1; on smaller timeframes, the difference in calculations is almost invisible.
As an example, we will give a strategy for the highly volatile GBP / JPY pair. Stochastic (9, 3, 3) and RSI (7) indicators are used in combination with candlestick analysis.
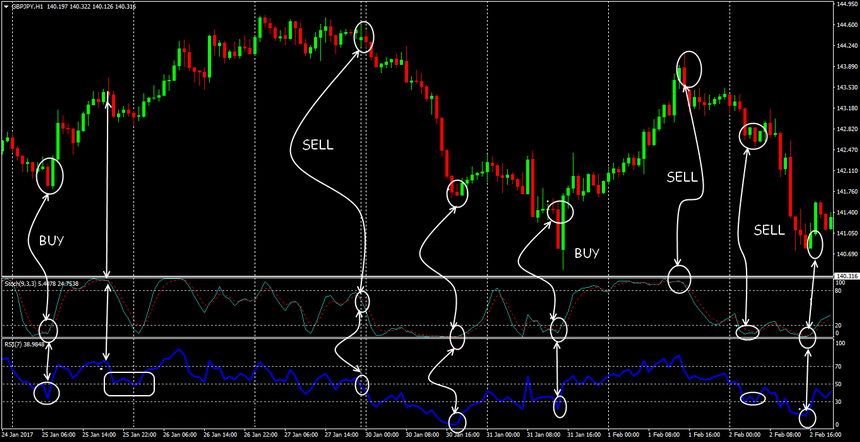
Buy: Stochastic is in the oversold zone, RSI is below the center line (at least); the last closed candle is bullish and closed in the middle of the previous one or higher. For sale – we reason in the same way.
We close (or reverse) when the position of the oscillators is shifted to the opposite zone. StopLoss by classic money management (but not less than 50 points), TakeProfit – 80-100 points with an average trailing.
Stochastic + Trend
Any tracking indicators (moving averages, channels) are used to assess the presence, direction and strength of a trend, and the stochastic acts as an impulse confirmation of a trading signal. As an example, we propose a combination of standard Bollinger and Stochasic bands (5,3,3) on H1 for GBP / USD.
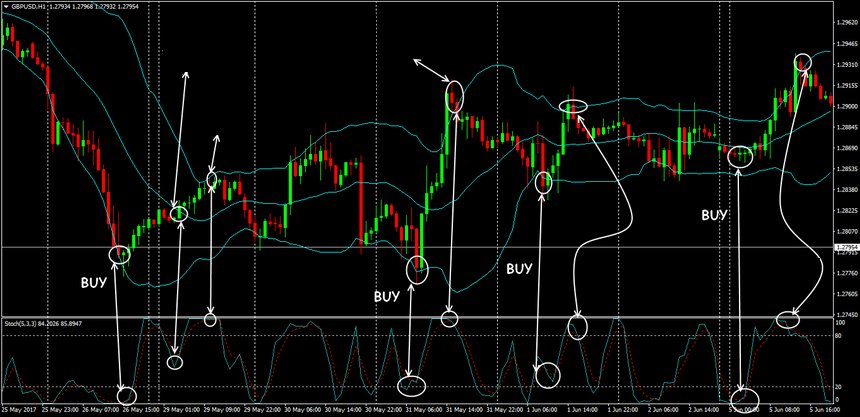
For the Bollinger Bands indicators and the Stochastic indicator, the description is traditional – buy: the price should go beyond the lower border of the channel, and the fast line the oscillator crosses the slow one from the bottom up (ideally, in the oversold zone). The position is opened after the close of the candlestick, where the Stochastic crosses. StopLoss – below the nearest local minimum; the first TakeProfit level is the central Bollinger Bands. For sale – we reason in the same way.
Stochastic + MACD
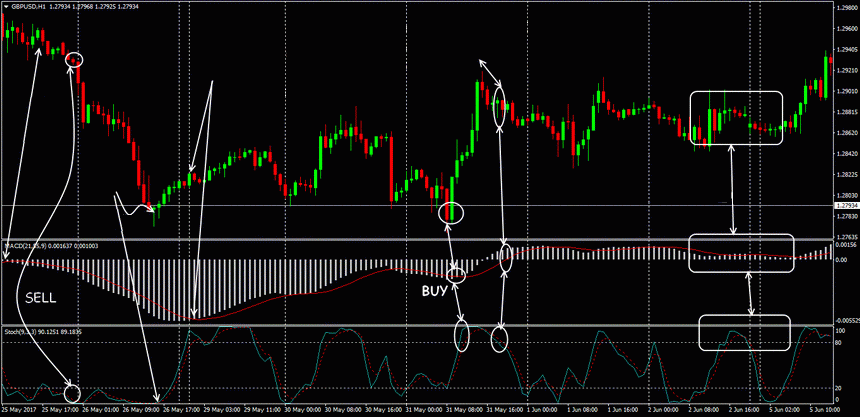
Traditional signals to enter from the MACD indicator are ahead of Stochastic, the crossing of its lines is used as confirmation. For closing, the situation is reversed: the stochastic reacts first. Position opening – after signals from two indicators. The disadvantage of the system is considered to be a lot of false signals on small timeframes.
Stochastic + ADX
In such a scheme, the Stochastic indicator estimates the strength of the momentum, and the volatility indicator should assess the market activity in the direction of the signal. Entry by oscillator signals, but ADX should show volatility over 20%.
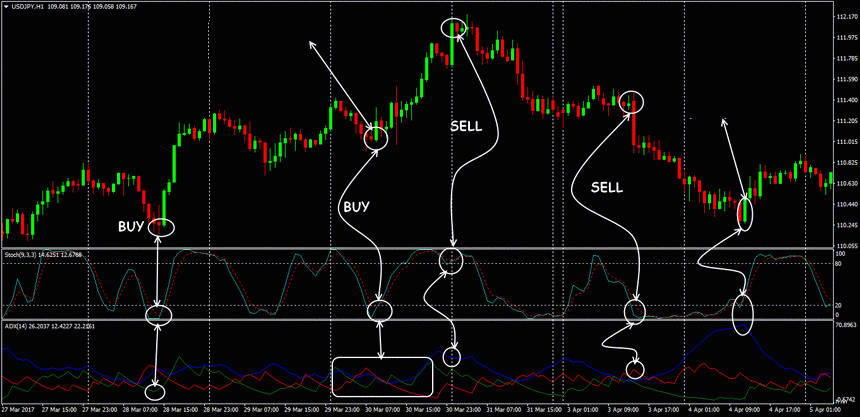
The corresponding ADX line (green – growth, red – fall) should show active dynamics. The concept of a flat for these indicators is somewhat different,therefore, often a clear signal on the stochastic is not confirmed by the ADX lines. For stable trading, it is recommended to add a moving average with a period of at least 20 to the system.
Conclusion on strategies based on the Stochastic indicator
Setting the parameters of the Stochastic indicator should take into account the general trading style: intraday strategies catch small movements along the trend and require short-term setups. Long-term parameters help position traders to avoid false signals. Many trading strategies use different versions of the Stochastic indicator as a basic oscillator, which confirms its value for modern technical analysis.


