The Ichimoku Kinko Hyo was invented by a Japanese journalist in the early 1930s. Although it looks complicated, it is a set of self-contained technical analysis indicators, which can not only help investors judge market trends but also give hints. Support resistance and the strength of support resistance, and then assist investors to find opportunities for entry and exit.
The “one eye” in the Ichimoku Kinko Hyo means to take a look. Just like the name, it means that you can get a general understanding of the market situation by just looking at it. Because of its pursuit of completeness and systematicness, the process of explaining this indicator will be slightly complicated, but after understanding it, we can quickly make a judgment on the market situation.
Basic knowledge of Ichimoku Kinko Hyo
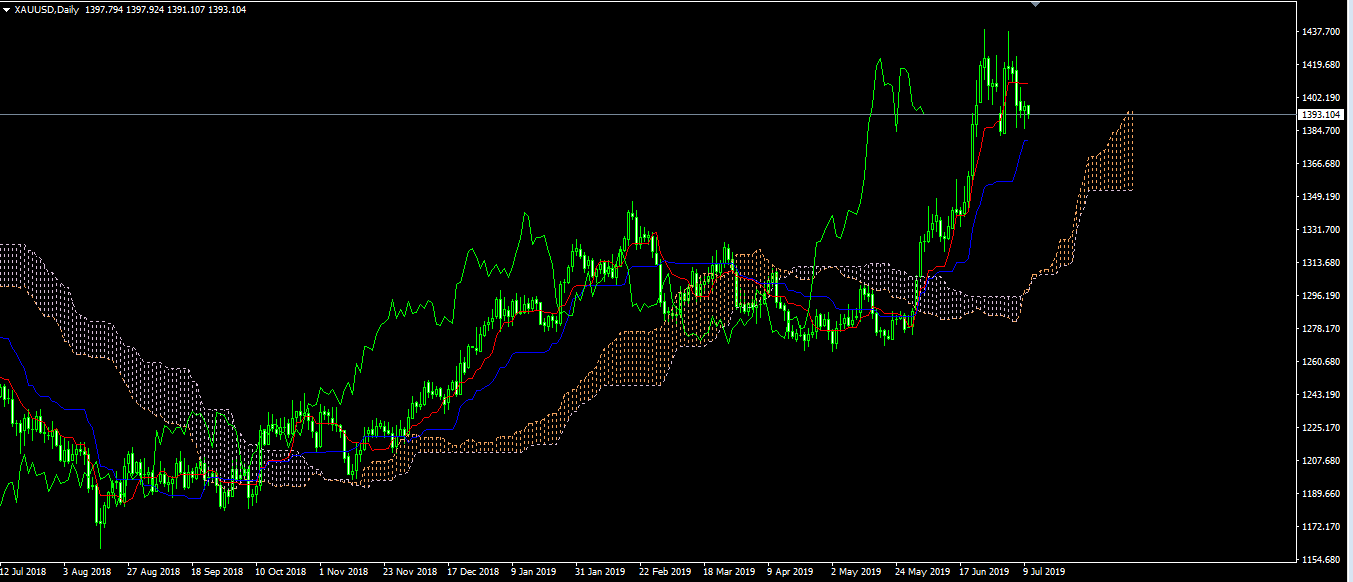
The Ichimoku Kinko Hyo consists of 5 lines, namely the reference line, the turning line, the delay line, the leading zone A and the leading zone B. Its default settings are shown in the figure below. Among them: the red line with a higher degree of adhesion to the price trend is the turning line, the blue line is the baseline, and the green line with the highest degree of deviation from the price is the delay line. Correspondingly, the upper rail and the lower rail in the dotted line are the preceding zones A and the preceding zone B.
The function of the turning line and the reference line is similar to the moving average. When the turning line is up and forming a golden cross with the reference line, it is a bullish signal. Otherwise, it is bearish. The delay line is to confirm the bullish or bearish signal. If the delay line is above the closing price of the corresponding K line when the turning line and the benchmark line are above the closing price, the bullish signal is confirmed. Otherwise, it cannot be confirmed.
The cloud area is the judgment of future support and resistance. If the cloud area is thicker, it means that the support/resistance here is strong. On the contrary, it represents weaker support/resistance. It is worth noting that the cloud area is a forward-looking indicator, it will walk in front of the price (26 K lines ahead), is a prediction of future support and resistance. The delay line is behind the price (26 K lines delayed), which is a confirmation of the price signal.
The relative position of price and cloud area
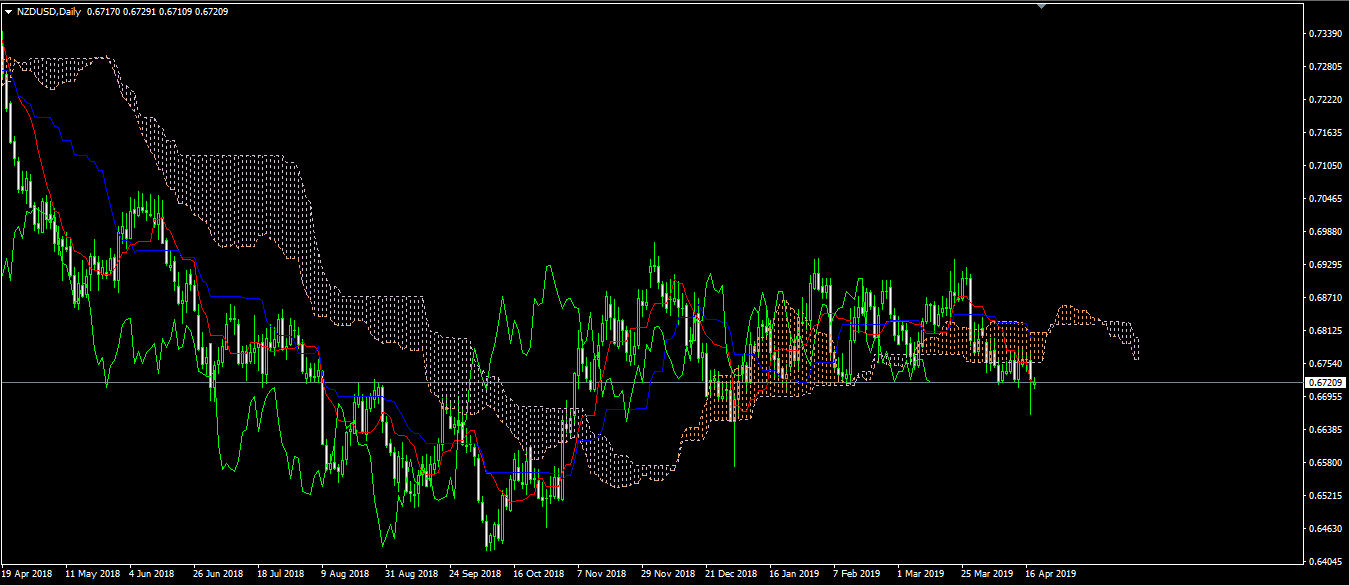
The position relationship between the price and the cloud area can better explain the current market strength:
- when the price is above the cloud area, it indicates that the bulls have an advantage;
- when the price is below the cloud area, it indicates that the shorts have the advantage;
- when the price is inside the cloud area, Indicating that the market is in shock and the direction is unknown.
This is easy to understand. For example, when the plane is flying above the clouds, it will be very stable and continue to fly at high speed. When the plane flies into the clouds, there will often be relatively strong turbulence and turbulence. When the plane lands below the clouds, it often means that the plane is slowing down and may soon begin to descend. The relationship between price and cloud area is similar.
Thickness of cloud area
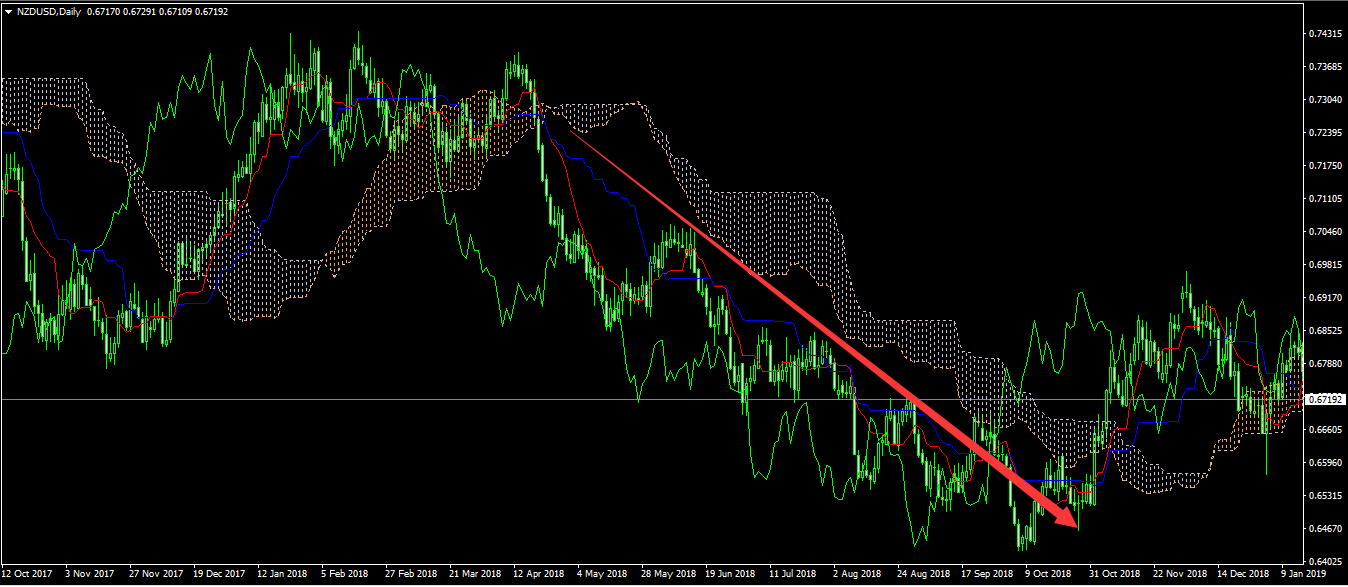
As mentioned earlier, the thicker the cloud area, the stronger the support/resistance here. On the contrary, it represents weaker support/resistance. We can still use the example of an airplane passing through the clouds to explain. When the clouds are very thin, the airplane can fly through the clouds without any effort. If the clouds are thicker, the aircraft may experience a longer period of turbulence and turbulence.
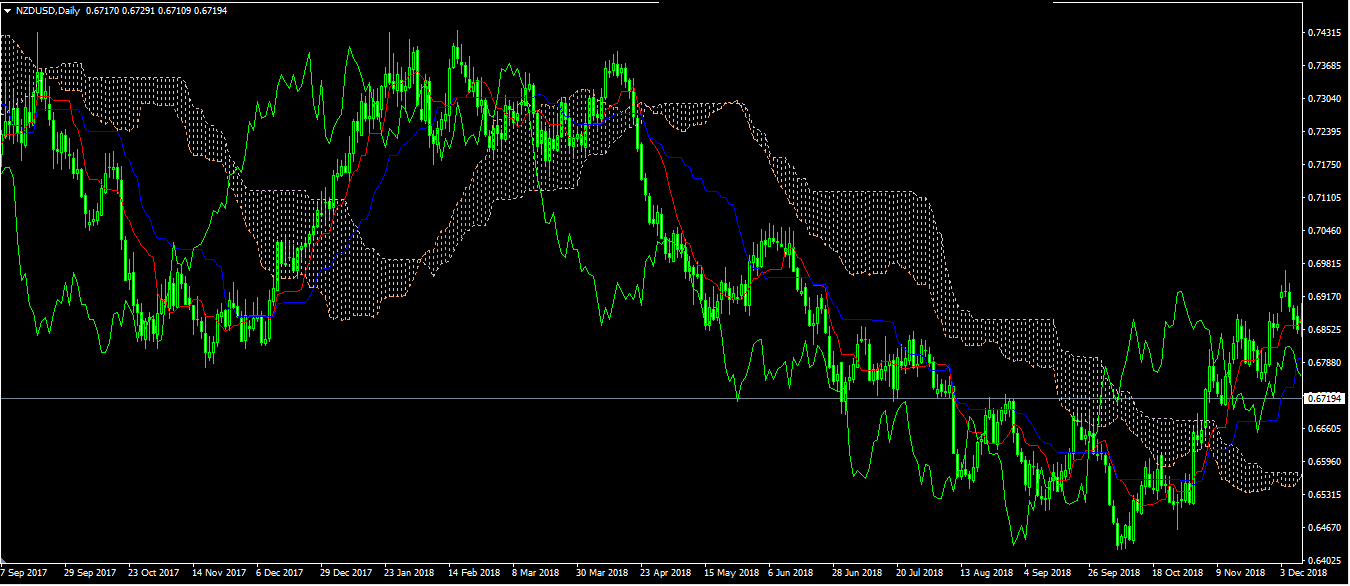
Another zone is to reveal the role of clouds or sustained trend reversal probability. If the cloud area becomes thicker, it means that the short- and medium-term trend momentum begins to weaken, and the current trend may be reversed. Conversely, when the cloud area becomes thinner, it means that the kinetic energy is strengthening in the short to medium term, and the current trend may continue.
The thickness of the cloud area can also reveal the volatility of the current market. The greater the volatility, the thicker the cloud area, and vice versa. When the price is far from the cloud area, it means that the price is far from the equilibrium price at this time, that is, the volatility is relatively large. Conversely, when the price is closer to the cloud area, it means that the price is closer to the equilibrium price, and the volatility is smaller at this time.
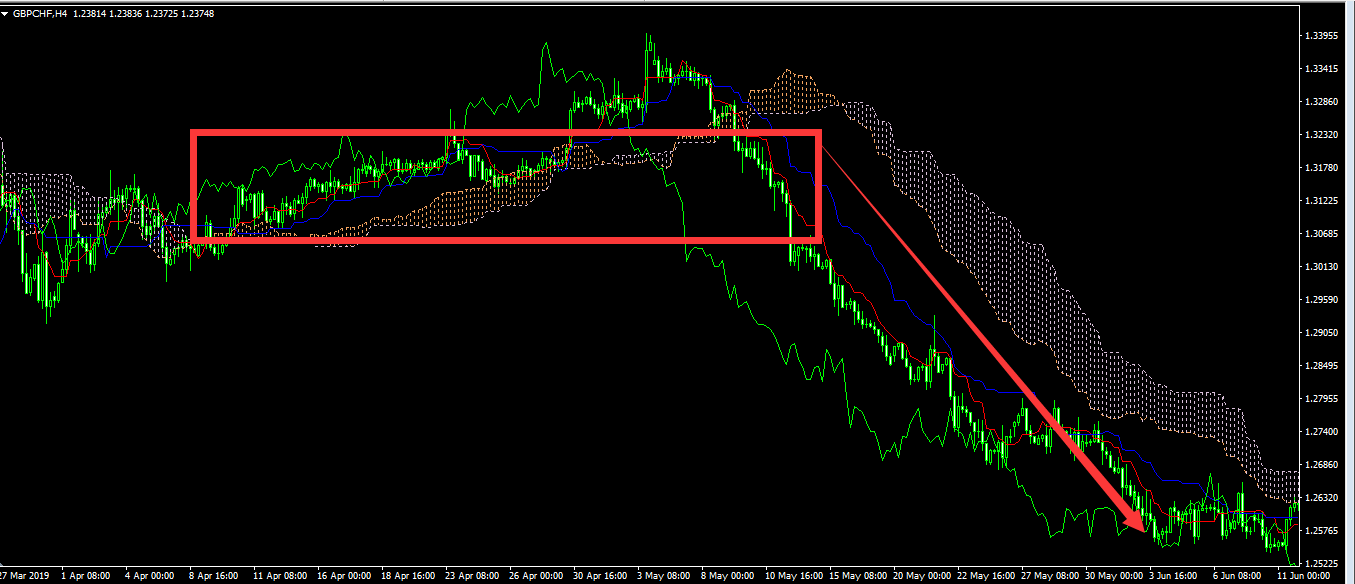
Generally speaking, prices suddenly enter a period of high volatility after maintaining a period of low volatility. This is because the market will eventually choose to break in a certain direction after a period of consolidation, and the subsequent herd effect will also intensify price fluctuations in a certain direction.
Investors familiar with the Bollinger Band may know that the narrowing of the Bollinger Channel means that the standard deviation between the upper rail and the lower rail becomes lower and lower, and the price volatility tends to increase after the opening narrows. And choose a direction to breakthrough. But the Ichimoku Kinko Hyo reveals this idea in the very early Biblin channel.
As can be seen from the figure below, the cloud area has maintained a relatively thin state for a long period of time, but shortly thereafter, the price has experienced a long-term unilateral downward trend.
The turn of the cloud
In an upward trend, when the cloud area becomes thinner and the leading zone A and leading zone B begin to cross, it means that the high point of the market at this time has no longer continued to rise. If the leading zone A falls below the leading zone B, it means that the cloud area is turning. At this time, the cloud area changes from green to red. At this time, the price trend may be about to reverse.
If the high point of the price starts to fall gradually, then the median price of the price will fall at this time, and accordingly, the conversion line and the benchmark line will turn down. The calculation method of the leading band A is to divide the sum of the conversion line and the reference line by 2. When the leading zone A drops, the cloud area will become thinner. At this time, people have stopped doing more and the price will no longer hit a new high.
If the baseline and the conversion line continue to fall, the leading zone A will also follow the decline. When the leading zone A falls below the leading zone B, it means that the price has officially entered the bearish zone, because at this time the price has fallen below the middle price of the past 52 days (or the corresponding K-line cycle) and has fallen to the past Below the 50% callback from the 52-day (or corresponding K-line cycle) highest point.
A breakthrough in the cloud zone
Cloud breakthrough is also a common strategy. If the price closes firmly above the cloud area, it means that the price is likely to enter a strong upward trend. If the price closes firmly below the cloud area, it means that the price may enter a strong downward trend. The reason why it is said to be a “stronger” up/down trend is that at this time the last line of defense of the price has been broken.
In the Ichimoku Kinko Hyo, prices have 4 lines of defense, which are the conversion line, the baseline, the leading zone A, and the leading zone B. This means that in order for the price to enter a downtrend, it must drop below these four lines one after the other.
On the contrary, the end of the bull market is often accompanied by the price falling below the conversion line, the baseline, the leading zone A and the leading zone B successively. Especially when the price falls below the leading band B, if it is matched with a larger trading volume, it will be a bear market breakout at this time.
