What is Moving Average? How to use it for Forex trading? Table of Contents
Moving average is the most widely used and most effective indicator in technical analysis.
Traders of all levels use this tool to determine long-term trends.
We will introduce how to define a trend, how to use this indicator to identify support and resistance levels, and how to use it as a trade entry and exit signal.
What is a moving average?
Moving average (MA) represents the average trend in the selected time period, smoothing prices and filtering out noise.
They consist of the average closing price over a certain period of time.
For example, the ten-day simple moving average is the sum of the closing price of the ten-day period divided by ten.
The most commonly used moving averages are:
- Simple Moving Average (SMA)
- Simple Moving Average (SMA), which means that prices are averaged within a certain period of time.
- Exponential Moving Average (EMA)
- The Exponential Moving Average (EMA) is similar to SMA, but it focuses on the weight of the recent price quotations, so it can overcome the lag of the indicator signal to the price trend in use.
Use the Moving Average on OctaFX’s platforms
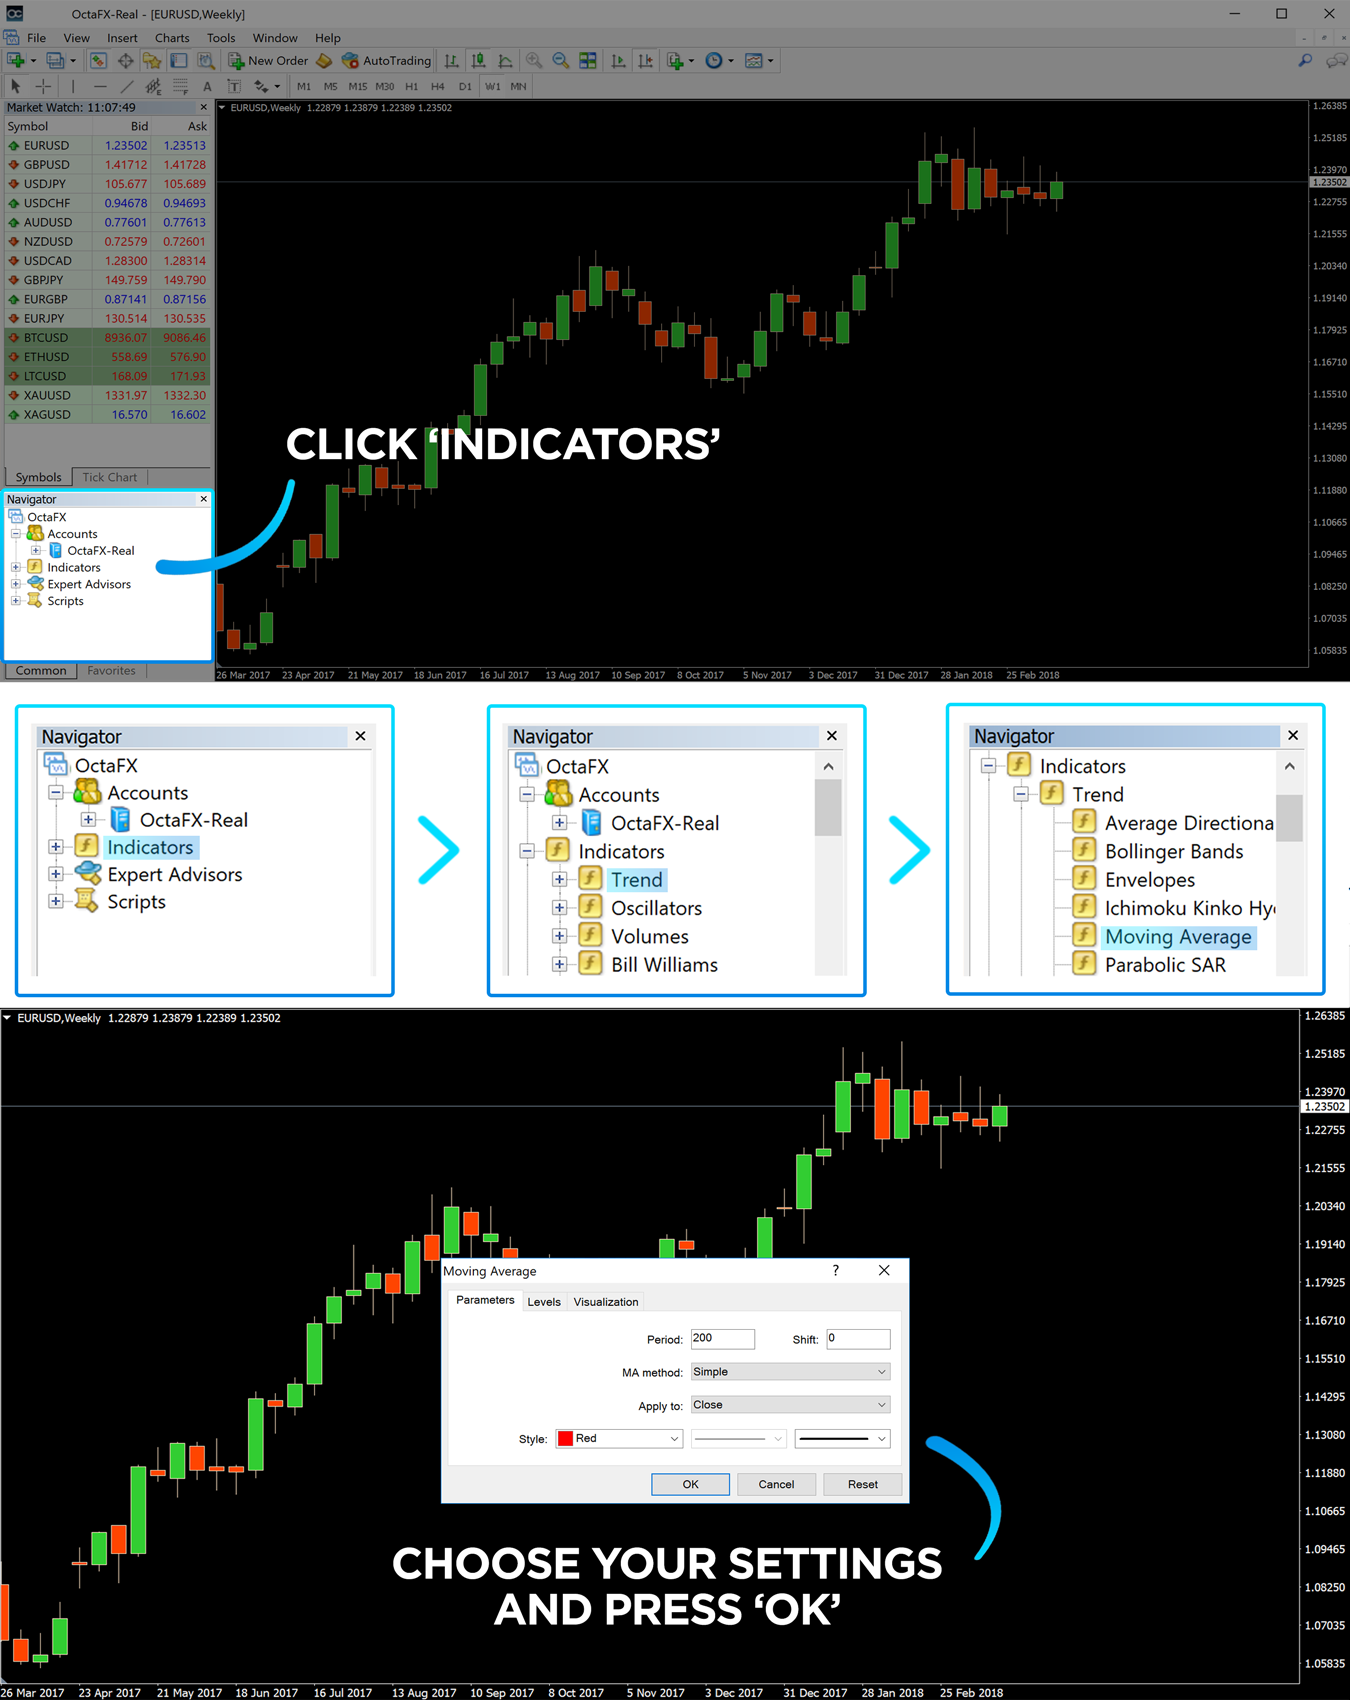
How to add a moving average to your chart in MetaTrader4
Simply click on the “Indicator List” icon in the toolbar and select “Moving Average” to add the moving average to the chart.
From there you can choose the time and type you want to use.
If you use multiple moving averages, you can change the color to easily identify them.

Open OctaFX’ss MT4, MT5 or cTrader Account
Simple moving average and exponential moving average
Moving averages are slower than exponential moving averages in response to prices.
Although they are slow to indicate a trend or a trend reversal, they are less prone to false signals.
EMAs are better at catching up with trends, but they will give you more false signals during periods of volatility.
Using multiple moving averages can provide you with more diverse perspectives.
For example, a trader may choose a smoother SMA to help understand a broader trend or enter the market based on an EMA signal that gives more weight to recent prices.
It is more reliable to use multiple moving averages with different time periods in conjunction with the simultaneous use, and use their crossing points to determine trading signals.
SMA can better identify support and resistance levels because they reflect the relatively stable average value of prices over a set period of time.
How to use a moving average to determine the trend?
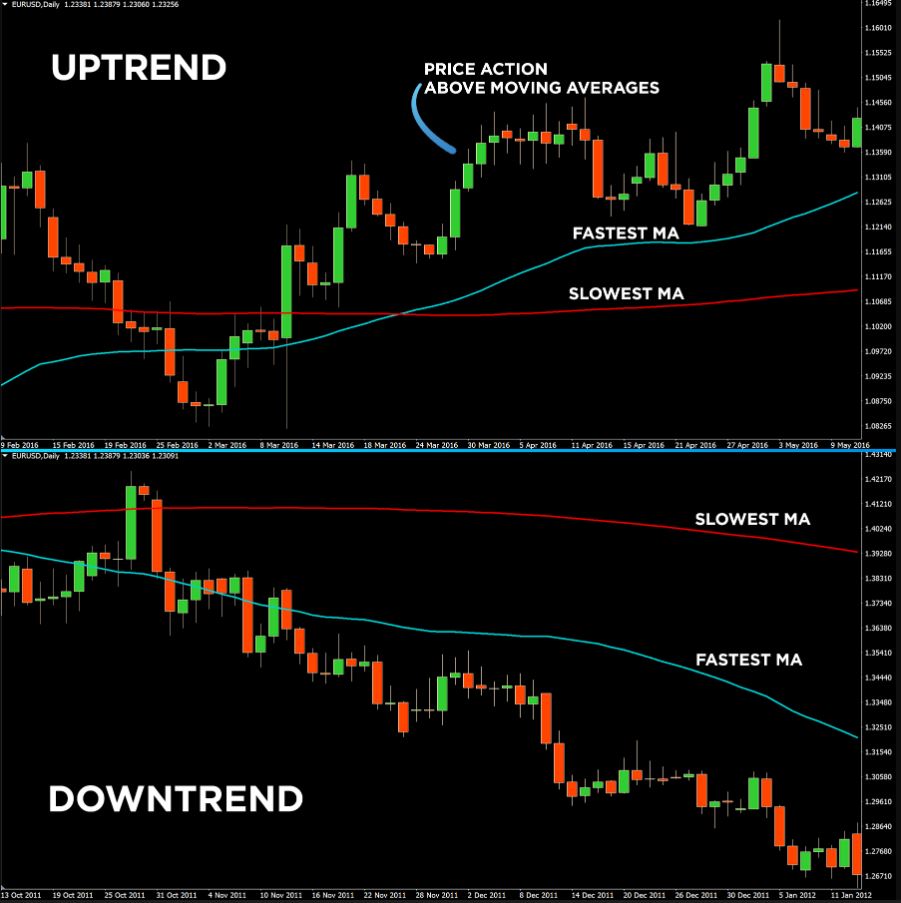
When the price fluctuation is higher than the moving average, the price will rise in the short term.
On the contrary, if the price fluctuation stays below the MA, it is shown as a downtrend.
Using multiple MAs at the same time can help determine trends such as cross-breaks: we can judge the possible breakthrough trend of individual stocks or the broader market from the cross of the moving average system.
If the short-term moving average crosses the long-term moving average and goes upward, there will be an upward trend, and if the short-term moving average crosses the long-term moving average and downward, then there will be a downward trend.
For example, the 5-day moving average crosses the 10-day moving average, and soon the 10-day moving average crosses the 20-day moving average, forming an upward crossover pattern, indicating the establishment of an upward breakthrough.
The same is true for judging the downtrend.
At present, the 5-day moving average is close to the 10-day moving average.

Use the Moving Average on OctaFX’s platforms
Moving Average Crossovers
The MA intersection helps determine when a new trend will start and when an existing trading trend will reverse.
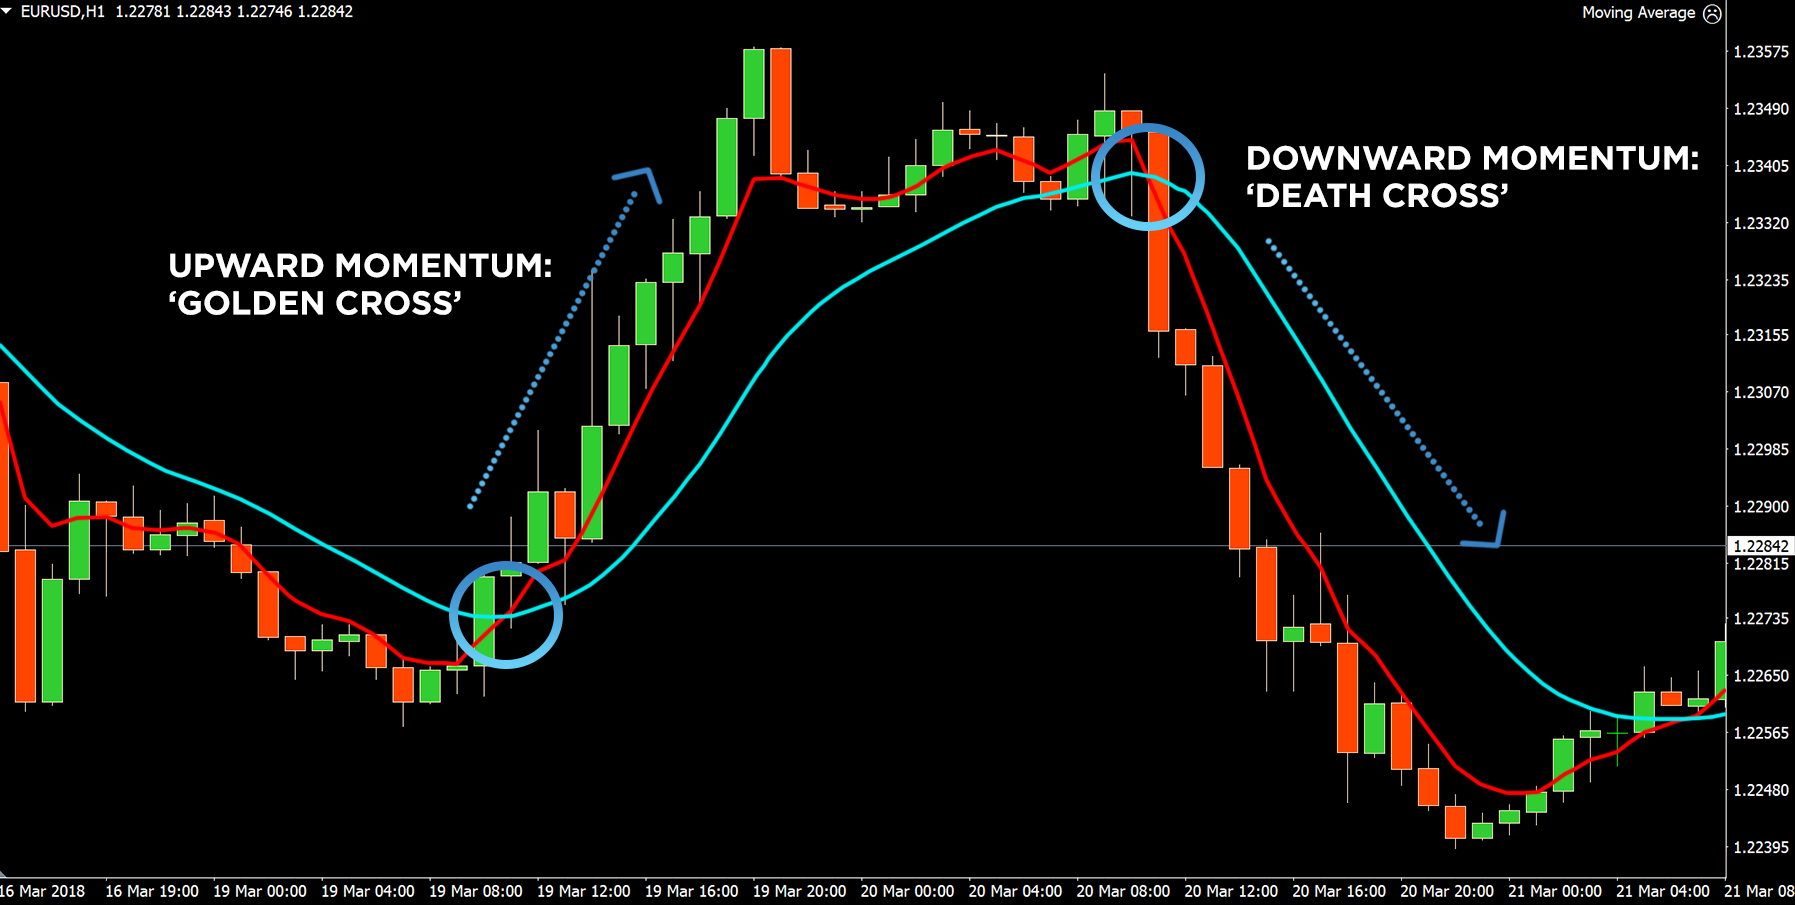
When the short-term MA breaks through the long-term moving average (for example, the 5-day moving average crosses the 20-day moving average), the intersection of the two lines confirms the upward trend, which is called the “golden cross”.
When the short-term MA crosses the long-term MA downward (for example, the 5-day moving average crosses the 20-day moving average) to form a “dead cross”, it is confirmed that the trend is about to reverse.
Short-term MA can be used for intraday trading, such as 5-day and 10-day EMA.

Long-term traders may prefer the SMA50 and SMA200 moving averages.
On the one hand, MA crossovers usually work well in trending markets.
On the other hand, they may be worthless in sideways or market turbulence.
Open OctaFX’ss MT4, MT5 or cTrader Account
Moving Averages as Dynamic Support and Resistance Levels
The moving average has two major functions: one is to indicate the direction; the other is to provide a basis for judging support and resistance.
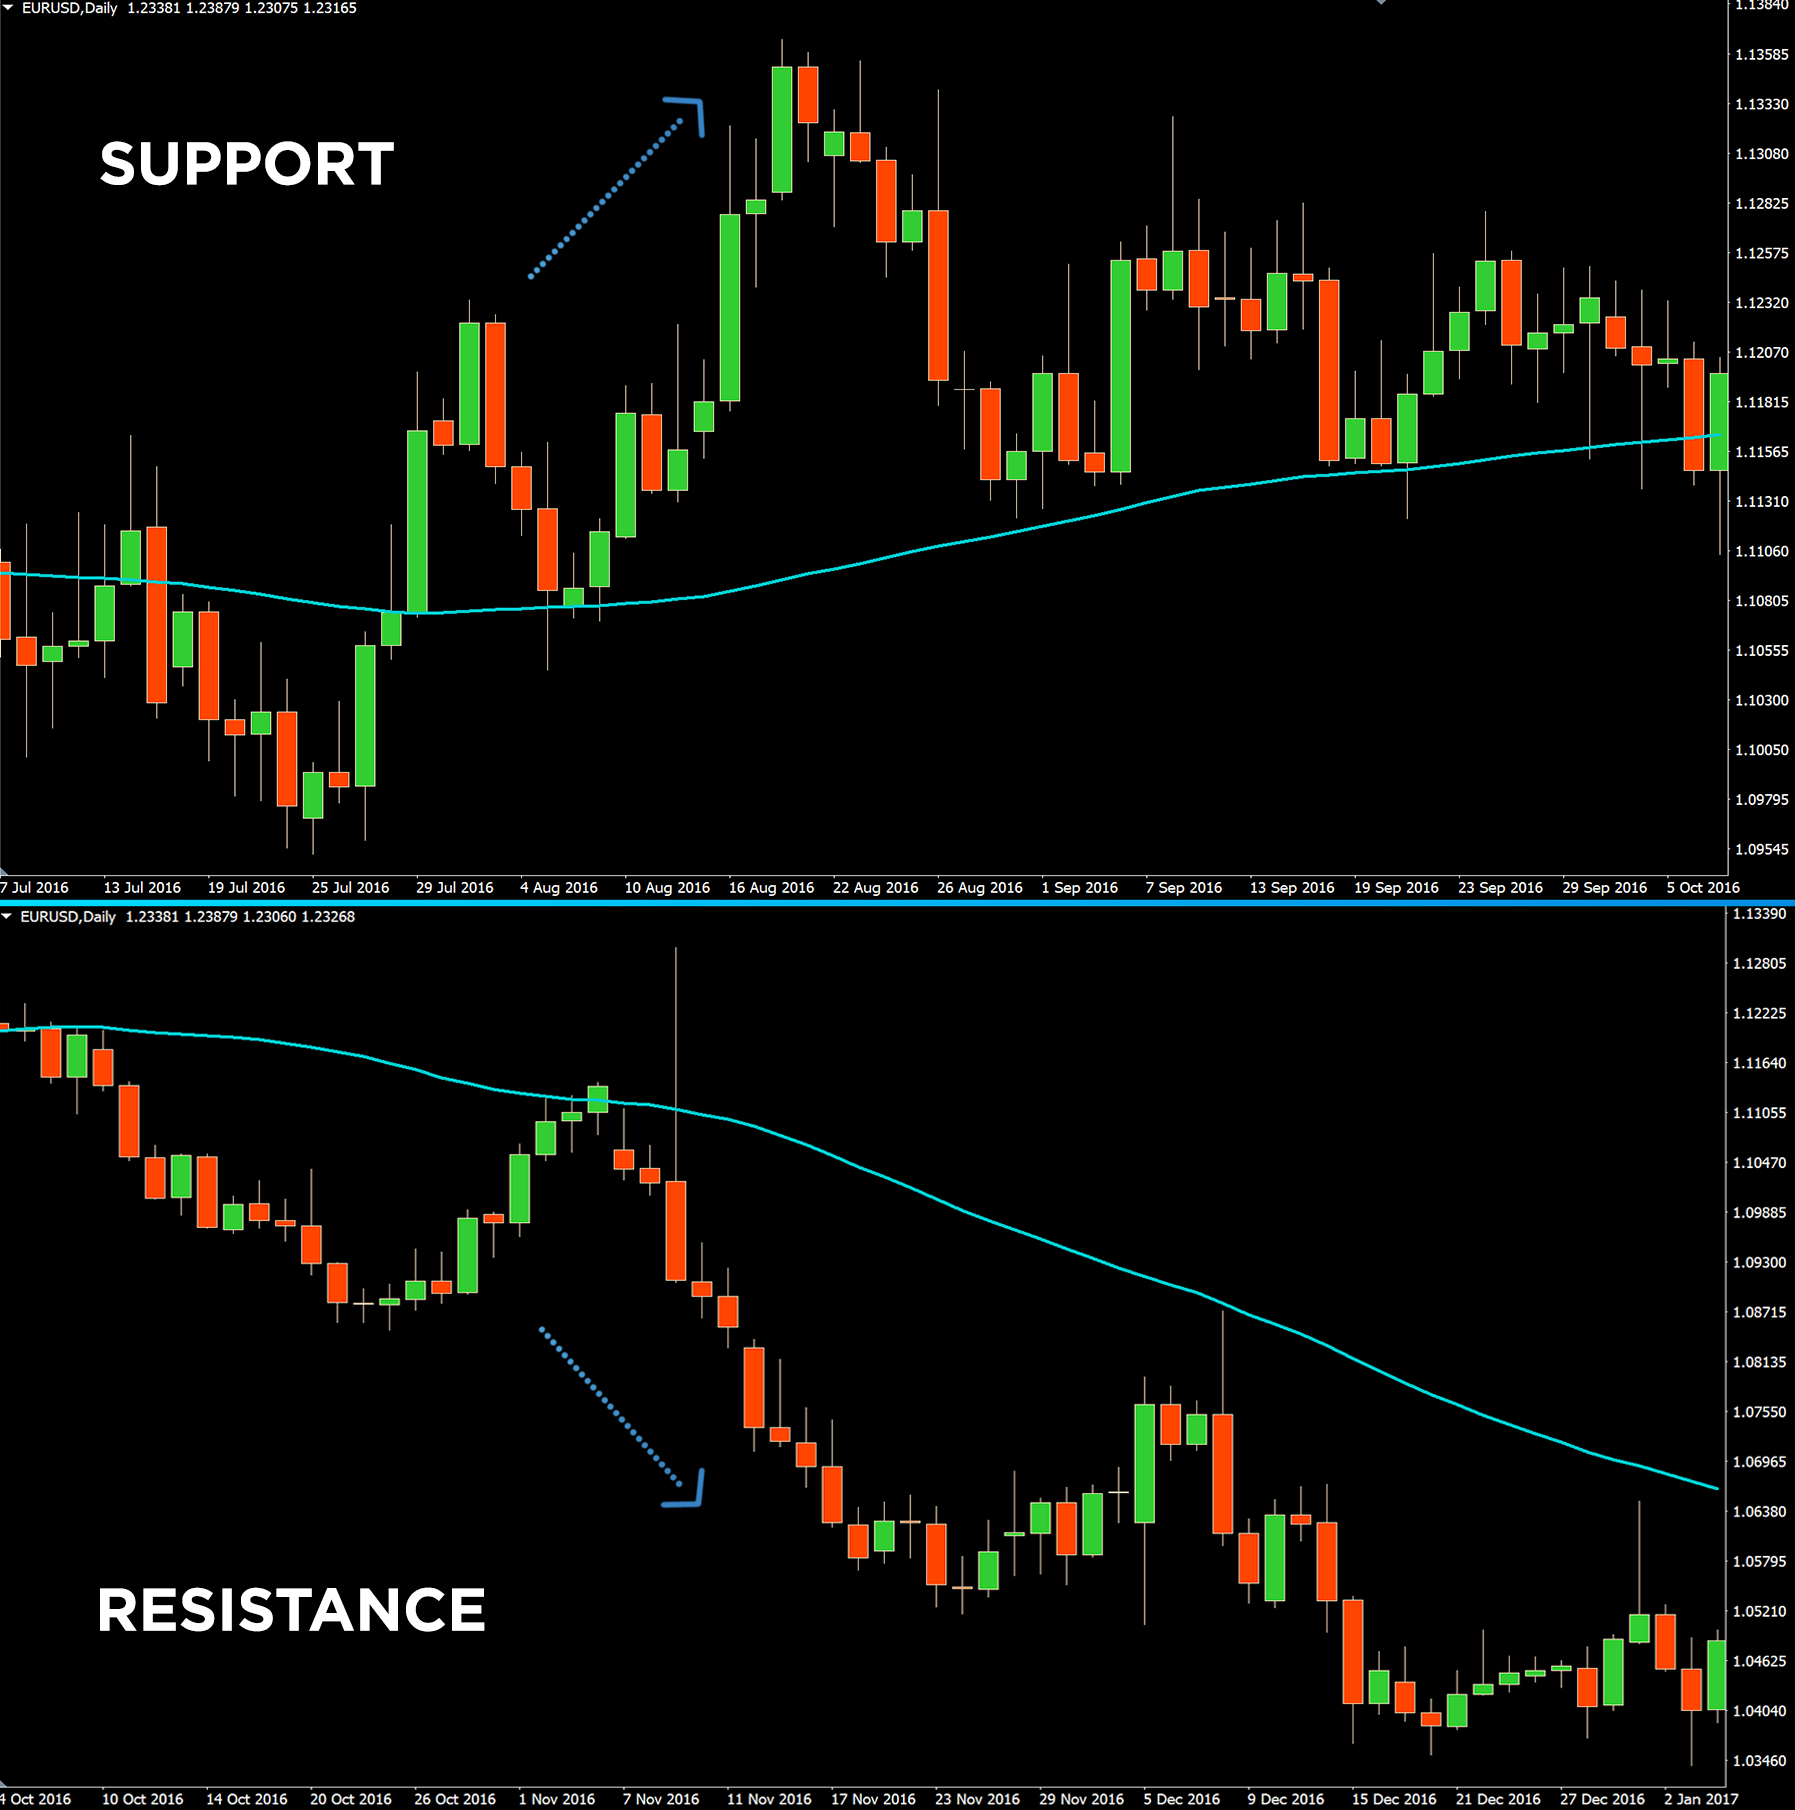
MA can also be used to determine the support level of the uptrend and the resistance level of the downtrend.
For example, a short-term uptrend may appear at a support level near the 21-day EMA, while a support position for a long-term uptrend may appear near the 200-day moving average.

The 50-day and 200-day moving averages often provide a basis for judging key support and resistance levels.
Please remember that this is not an absolute operating price.
More precisely, a moving average is an area where support and resistance levels appear.
Support and resistance levels are dynamic, and they change with recent price fluctuations.
MA is a multifaceted indicator that can help you define trends, support, and resistance.
It can also show when a new trend starts and when the trend is about to reverse.
Set up MA for different periods to determine the most suitable trading strategy for you.
Using a specific moving average combination can avoid you spending too much time to find the best moving average, but focus on judging whether the trend is stronger or weaker.
For example, some analysts use a combination of moving averages of 8, 21, and 55 to identify trading signals, and 100 and 200 to judge the trend; however, 100 and 200 are the most commonly used by investment banks.
The period of the slower moving average depends on personal preference and trading signals.
Please check OctaFX official website or contact the customer support with regard to the latest information and more accurate details.
OctaFX official website is here.
Please click "Introduction of OctaFX", if you want to know the details and the company information of OctaFX.


