Where can I see Live Forex Charts and invest online? Table of Contents
- Where to see Live Forex Charts?
- FXCM Forex Charts - Features and Functionality
- FXCM Forex Charts - Support and Tools
- Know the Bulls and the Bears
- Read a quote and make an investment
- How can I sell EUR when I don't have one?
- What is a "Pip"?
- Utilize FXCM's Economic Calendar
- FXCM Economic Calendar - Module and Function
Where to see Live Forex Charts?
Technical traders use graphical tools and indicators to identify trends and important price levels to enter and exit the market.
Use the table below to analyze the currency pair or instrument of your choice, change the time frame and explore a range of indicators.
Keeping up with the ever-changing conditions in the financial arena can prove challenging, especially when more than one stock or market is involved.
As the industry’s leading Forex and Contracts for Difference (CFD) brokerage firm, FXCM understands the active trader’s need to refer to timely price data and stay informed in changing markets promptly.
In order to help traders and investors accomplish this task, FXCM introduces Forex Charts, a web-based charting application that covers a large collection of instruments and asset classes.
Check out the Economic Calendar on FXCM
FXCM Forex Charts – Features and Functionality
One of the essential disciplines of technical analysis is charting.
Charting is the study of the relative value of a stock through a visual representation of the price action.
Charts are an integral part of any technical trader’s approach, allowing for the overlay of various tools and indicators on the price itself.
FXCM’s Forex Graphics application offers traders the ability to create fully customized price charts, making it possible to study an instrument’s price action advanced.
The following features are easily accessible via Forex charts:
FXCM Forex Charts Example:
- Chart Types
- Choose from different formats including bars, candles, Heikin Ashi, lines, area, Renko or Point & Figure.
- Customizable Periodicity
- Fully customizable intraday intervals are available as well as daily, weekly, and monthly time frames.
- Instrument Comparison
- Easily compare the performance of different instruments or indices using price hedges via the ‘add instrument’ feature.
- Indicators
- A robust suite of indicators is ready and available for advanced technical analysis. Furthermore, a complete selection of fundamental data is easily included in the graphic study.
FXCM Forex Charts – Support and Tools
FXCM’s Forex Charts are a versatile tool for studying financial instruments offered by all major global markets or exchanges.
Depending on the specific instrument and market, price data is streamed in real-time or on a delayed or end-of-day (EOD) basis.
Listed below are the fundamental tools and data supported by the Forex Charts application:
- International Indices
- Data on Indices from major global exchanges.
- Cryptocurrencies
- A wide variety of cryptocurrencies and related products.
- Economic data
- Fundamental economic statistics.
- Quandl Financial Database
- A wide range of regional and international economic data
- Forex
- All majors, minors, and exotic currency pairs.
- CFDs
- A wide variety of the most commonly traded CFDs are available.
- Futures
- All major global derivatives products and exchanges.
- Equities
- Securities from all major global exchanges and OTC markets.
FXCM’s Forex charts are more than just a currency trading search module.
It is a robust suite of financial information, offering traders and investors a vast collection of market-related data.
Whether you are a rigorous practitioner of technical analysis or a supporter of market fundamentals, Forex charts provide the functionality and information you need to make informed and solid trading decisions.
Know the Bulls and the Bears

In looking to the future, many traders get an idea of what a currency’s performance could be.
An optimistic trader who expects the value of the currency to rise is called a “bullish”.
Conversely, the negative trader who expects a currency to fall is called a “bearish”.
Bulls and bears challenge each other every day and the price trend will follow the preponderant turnover.
FXCM’s job as forex traders is to look at the available currencies and then buy the stronger one and sell the weaker one.
If after reading the news, you take a bearish view on the euro and a bullish view on the US dollar, you could materialize that view by selling euros and buying US dollars.
What are Bull and Bear market concepts?
Read a quote and make an investment
Since the investment is based on the relationship between two currencies, the prices of the Forex market are always referred to in pairs.
Although initially, it may seem unclear, in reality, this method will immediately appear very immediate.
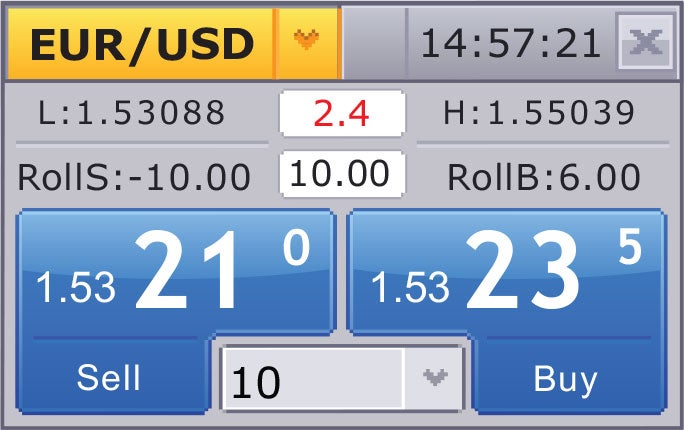
On the right is an example of EUR/USD quotes. It shows you the value of one euro (EUR) in US dollars (USD).
If you want to look at the euro in terms of the Japanese yen (JPY) instead, you should look at the EUR / JPY exchange rate.
If you want to see the value of one US dollar in Canadian dollars (CAD), you will have to look at USD / CAD.
Let’s say you want to sell EUR / USD at 1.4022.
If the EUR / USD falls it means that the euro is weakening while the US dollar is strengthening.
Let’s say EUR / USD drops to 1.3522. In that case, you would make a profit. If it had risen to 1.4522, you would have suffered a loss.
So, remember that: if you sell a pair, it’s good that it goes down; if you buy a pair, it is good that it goes up.
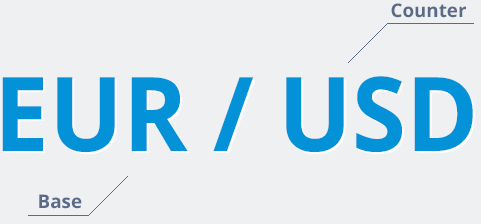
In a currency pair, the former is the “base currency” while the second is the “currency counter”.
When you buy or sell a currency pair, you make that trade on the base currency.
So, if you are bearish against the euro, you could sell EUR / USD. Now, by selling EUR / USD, you are not only selling euros but also buying US dollars.
If you are more bullish on the Japanese yen than you are on the US dollar, you could sell EUR / JPY instead.
It will all depend on you.
How can I sell EUR when I don’t have one?
You can buy or sell anything available on your trading platform even if you don’t have that currency.
Trading in forex means speculating on the exchange rate, and this you do by borrowing euros.
For most forex traders this is the norm, and also gives you access to leverage which will allow you to multiply your profits and losses.
And now let’s consider this example.
When you sell EUR / USD, you borrow 1,000 euros and sell it to someone else on the market for the equivalent in US dollars.
This you did when the EUR / USD price was at 1.4022.
In that case, you borrowed € 1,000 and sold it for $ 1,402.20; US dollars that you have kept.
Two weeks later you sold those US dollars at the rate of 1.3522.
Since the EUR / USD price has dropped, you will eventually have more euros than you had borrowed.
You will then return the € 1,000 borrowed by collecting the profits represented by the remaining € 36.98.
If the price had instead risen to 1.4522, those € 36.98 would have been a loss.
It will be up to the trading platform to make the necessary accounting calculations and report any profits or losses directly to your account.
So remember, buying currencies that are going up Selling currencies that are going down.
To do this, find the best couple.
What is a “Pip”?
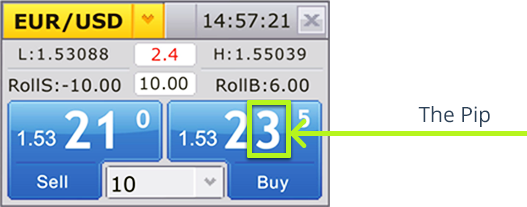
A pip is a unit in which profits or losses are counted.
Most currency pairs, with the exception of Japanese yen pairs, are quoted with four decimal numbers.
This fourth position after the decimal point (equal to 100th of a hundredth) is what we normally look at to define a “pip”.
Each point that that position moves in the quote constitutes 1 pip of movement.
For example, if the EUR / USD index rose from 1.4022 to 1.4027, the EUR / USD rose 5 pips.
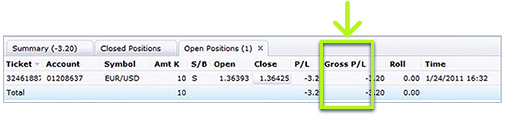
The monetary value of a pip can vary depending on the size of your trade and the currency you are trading.
FXCM demo accounts typically trade increments, or “micro-lots”, of 1,000 units of the first currency. In a standard EUR / USD demo account the value of 1 pip is equal to $ 0.10 per lot.
If you were trading 3 micro-lots, you would have had 3 pips of profit or loss for each pip of movement of EUR / USD, and therefore $ 0.30 of profit or loss.
Some currency pairs have different pip values.
For example, EUR / JPY pips are valued in Japanese yen. USD / CAD pips in Canadian dollars, and so on.
We repeat that your trading platform facilitates calculations by automatically performing all required calculations.
What are Pip and Fractional Pip in the Forex market?
Utilize FXCM’s Economic Calendar
FXCM’s Economic Calendar is a simple tool for keeping track of important economic events that could impact your trading.
Quickly analyze past data versus market consensus and check volatility for potential trading ideas.
You can also search for economic events that are most important to you.
Past performance is not representative of future results.
The time is changed to reflect the user’s location.
FXCM Economic Calendar – Module and Function
As a tool to help currency traders stay up to date on events affecting the market, the Economic Calendar provides forex traders and investors with a structured method to identify when and how an economic event can potentially impact the market.
When it comes to currency trading, staying “in the know” requires a person to know relevant information in a timely manner.
FXCM’s Economic Calendar presents all predictable economic events directly to the trader, making it a powerful analytical tool for quantifying market fundamentals.
The Economic Calendar is a comprehensive representation of a broad spectrum of relevant data, with an emphasis on organization and clarity.
For quick and easy reference, the following items are listed in a simple and tabular way:
- Program
- The scheduling function can be sorted to reflect events occurring today, tomorrow, this week, or next week. In addition, a reliable search engine is available to locate the period of specific events based on the desired criteria.
- Hours of the day
- Depending on the type of event, the timing of the event can bring considerable volatility to the market. Users are provided with a detailed list of the exact moments of the event in relation to the user’s location and time zone.
- Concerned Currencies
- The economic calendar notes the currency that is particularly affected by the event in question. For example, if the European Central Bank (ECB) is in the process of issuing a public statement on the future of monetary policy in the Eurozone, the euro (EUR) is listed as the currency most likely to be affected.
- Event
- An economic event is anything that can have a substantial impact on a sector or on several instruments. The release of official economic reports to the public, holidays, and central bank or government statements can be determinants of market behavior.
- Volatility Index
- Perhaps the biggest unknown to an economic event is its potential impact on market conditions. The Economic Calendar addresses this question directly by projecting the importance of price volatility using a color-coded scale.
- Consent of Industry
- The industry consensus is the market’s “most anticipated hypothesis” regarding a pending economic event. Analysts, investors, and other market professionals often make predictions about the actual data that will be released in a future economic data release.
- Previous data releases
- A previous release of economic data is the actual data of a previous economic event of the same type. It is commonly used as a reference for the evolution of strength or weakness, as well as for the historical context.
- Current data releases
- Real data is the important information disclosed to the public during the event. An example is the release of a nation’s quarterly Gross Domestic Product (GDP) figures.
Scheduled disclosure of economic reports, official statements, and statistical data often act as catalysts for greater volatility on the value of currencies.
For active traders, being aware of industry expectations, actual data and the exact timing of the event itself are key to help manage risk and maximize potential opportunities.
Please click "Introduction of FXCM", if you want to know the details and the company information of FXCM.