3 Golden Technical Analysis Patterns for Forex and CFD traders Table of Contents

3 Golden Technical Analysis Patterns
Technical analysis is widely used by investors around the world.
There are many technical formations and indicators, but it is worth starting with the basics because its simplicity could be its strength.
Formations can be divided into reversals and continuations and in this article, we present 2 reversal patterns and 1 continuation pattern.
All 3 patterns can be used in currencies, indices, commodities, or cryptocurrencies.
Learn about Technical Analysis with XTB
1. Double floor / Double roof
Double floor / Double roof is one of the most famous patterns.
It is simple but powerful: there is a second minimum in the double floor from which the price does not fall anymore or the second ceiling where the price does not break upwards.
In both cases, it indicates a weakening of the trend and makes a reversal more likely.
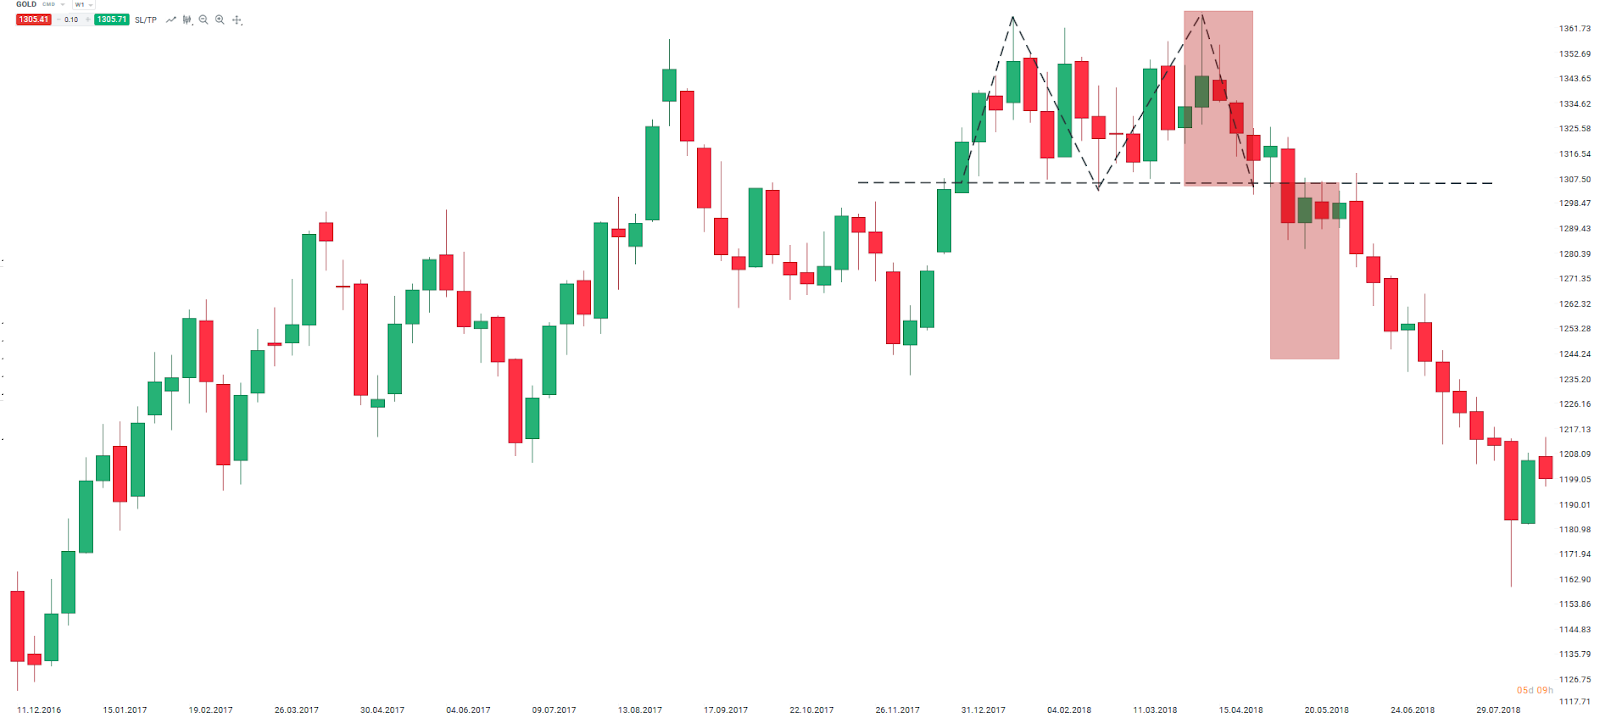
The double floor looks like the letter “W” and the double roof looks like an “M” and if the price breaks the top of “W” or the bottom of “M”, the trend can be reversed.
It is normally assumed that the range of price movement behind the figure is at least equal to the height of the letter “W” or “M”, as the case may be.

In this case, the formation range far exceeded the height of M and the formation actually marked the start of the new downtrend. Source: xStation5
Please note that the data presented refer to past performance data and therefore does not guarantee future performance.
2. Head and Shoulders (HCH) and inverted HCH

The HCH formation is similar to the double roof in that in both situations buyers cannot drive prices higher and this indicates a trend reversal.
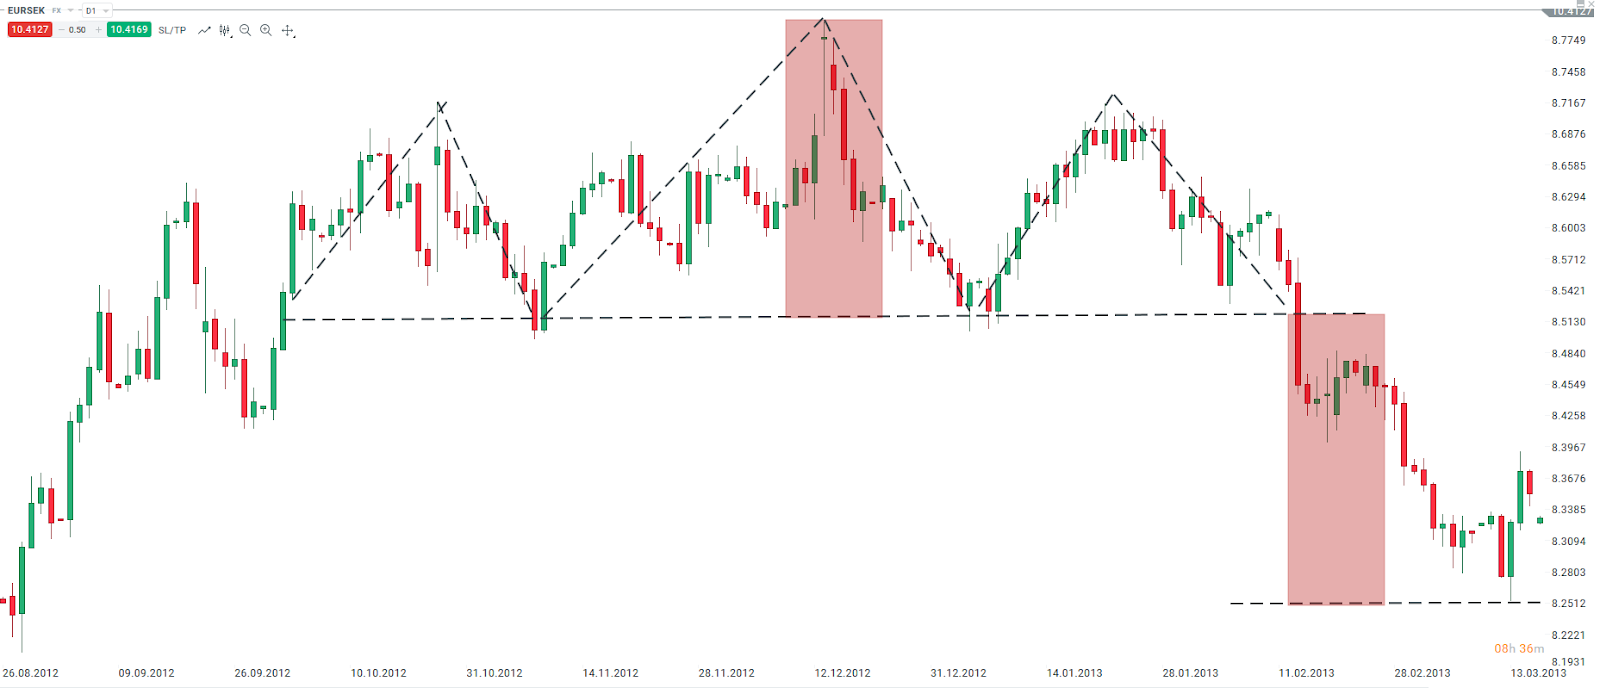
In this case, the highs 1 and 3 are lower and are called shoulders, while the highs 2 are at the top of the trend and are called head.
Highs 1 and 3 should be at a similar level.
The lows between highs are so important and should be around the same level to confirm the figure.
These lows create a “valley” that plays a fundamental role.
Once the price breaks at the neck of the figure, it confirms the formation.
The reversal range is the distance between the neckline and the head.
There is also the reverse formation of this figure,
HCH training at the EURSEK. You can see that the head distance was confirmed in the reversal. Source: xStation5
Please note that the data presented refer to past performance data and therefore does not guarantee future performance.
3. Cradle
Unlike the previous two, the wedge is a continuation pattern.
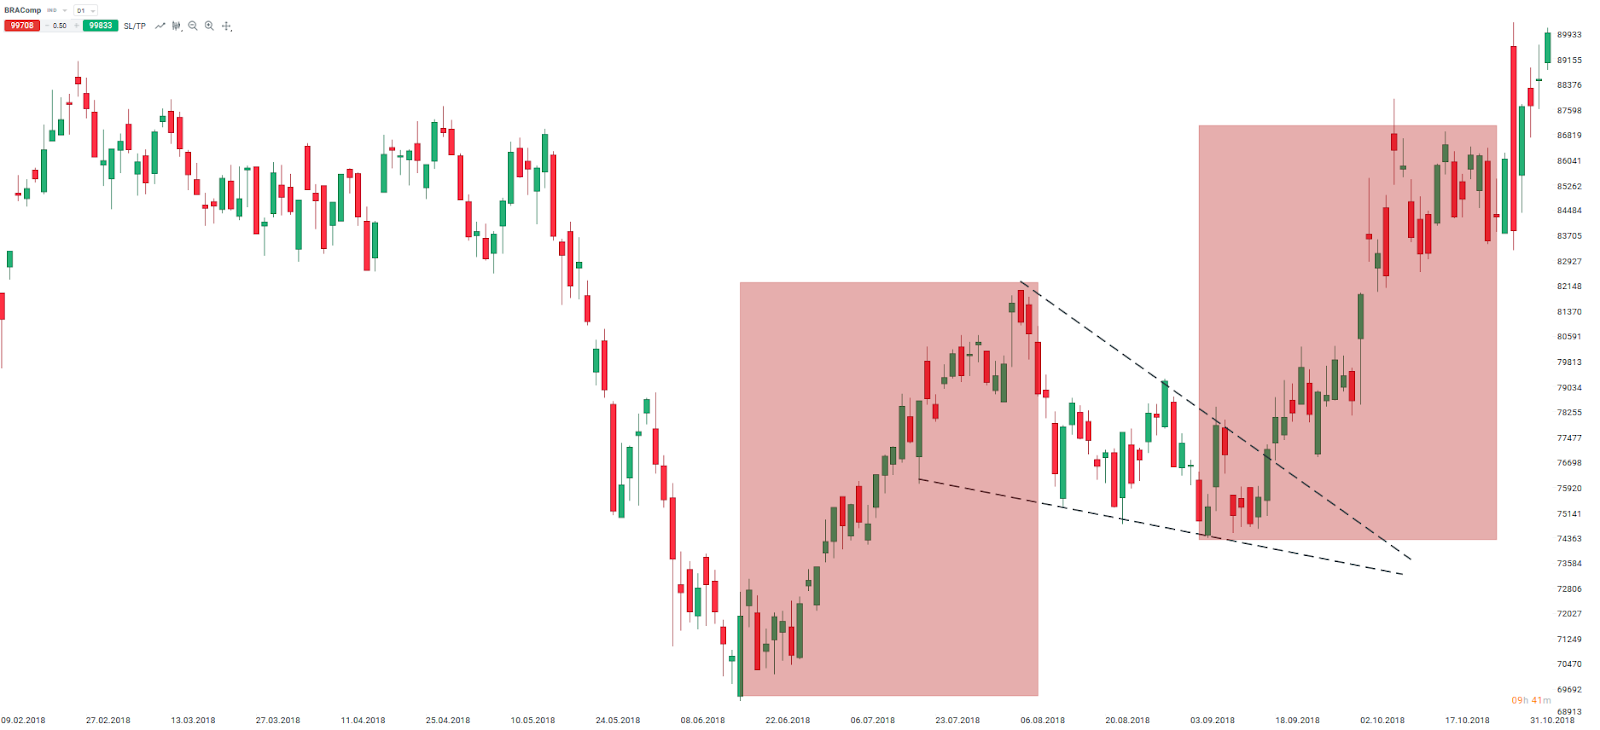
The wedge itself is a form of price correction/consolidation after a quick momentum move.
The amplitude of the price is decreasing within the wedge and when it breaks, it is followed by another impulse, it moves in the same direction as the first.
We can distinguish a descending wedge that separates the ascending impulses and an ascending wedge that separates the descending impulses.
The idea here is that the drop in volatility within the wedge shows a lack of interest among market investors to follow the direction of the wedge until it reverts to the original trend.

A falling wedge on the BRAComp was just a correction between the two price rises. Source: xStation5
Please note that the data presented refer to past performance data and therefore does not guarantee future performance.
3 Golden Rules of Technical Analysis
The three golden rules of technical analysis are:
- The market discounts everything
- The price moves in trend
- History repeats itself
The most popular ways to analyze the markets can be divided into 2 types:
- Technical Analysis
- Fundamental Analysis
While fundamental analysis focuses on the analysis of macroeconomic indicators, technical analysis focuses primarily on price analysis.
In recent years, technical analysis has gained popularity not only for its simplicity but also for its universal approach; This means that it can be applied to all market segments and at different time intervals.
Additionally, technical analysis is an analysis method that does not require financial knowledge.
To understand what technical analysis is based on, it is necessary to understand the three principles of technical analysis:
1. The market discounts everything
Technical analysts do not focus on macroeconomic and political events, they believe that any event that occurs around the world will affect the price of the instrument.
An event – such as a natural disaster or geopolitical tensions – may affect a certain market, but a technical analyst is not interested in the reason.
The technical analyst focuses on the chart and its shapes, patterns, and formations on it.
Start trading Forex and CFDs with XTB
2. The price moves in trend
Technical analysts believe that there is a greater probability that a certain market movement will continue to change its direction.
In other words, technical analysts believe that prices are trending.
This means that if trading is based on probabilities then to increase the probability of a successful trade, traders should always trade in the direction of the trend.
You can find some basic pro-trend trading methods here.
3. History repeats itself
One of the most popular technical analysis methods is based on the notion that history always repeats itself.
This means that charts tend to form figures that have occurred historically and analysis of past patterns helps traders predict future movements in the market.
This principle focuses on the notion that trading is connected to probabilities and the analysis of historical figures giving the trader a margin to open a position.
These figures are known as price patterns.
Why you should follow the trends?
All financial markets present three different trends in their movements; bullish, bearish or lateral.
We say that the market is not in the trend when it is moving sideways, where there is a constant battle between sellers and buyers.
Finding out which of these two types of trends the market is in can help us present interesting trading opportunities that come with clear guidelines.
This strategy is dictated by a single rule: operate the path of least resistance always operating in the direction of the prevailing trend. Imagine a wave approaching the shore; The simplest thing a trader can do is ride the crest of the wave, not swim against it.
Of course, a trend can change at any time, but you can use technical indicators and figures to try to recognize at what point the trend is going to change direction.
Learn how to trade CFDs with XTB
1. A rising market
If a market is on the rise, you can consider having a buy position in that market and trading with the dominant trend.
For example the path of least resistance.
The crux of the matter will be choosing the right moment to open a buy position.
The ideal would be to enter a buy position as low as possible, to maximize your possible profit.
Some traders can wait for a pullback (a small bump in the market) but carry with it the risk of waiting too long to enter the market and losing a possible future advantage.
A rising market, that is, an uptrend, shows a series of rising highs and lows.
This means that each floor (support) is higher than the previous one.
2. A falling market
On the contrary, if the market is in a fall you can consider selling, that is to say going down or short, in said market.
To maximize your possible profits you would have to enter the market as high as possible, thus maximizing any downward movement in price.
A bear market also called a downtrend, is when the market has decreasing highs and lows.
See available financial markets on XTB
3. A side market?
A market exhibits lateral movements when it is at an indecisive point and buyers or sellers are in neutral.
Buyers and sellers provoke each other, but no consensus is reached.
At this point, many traders are faced with two strategic possibilities; diversified trading or awaiting a breakout.
Generally, when a market is moving sideways, it is moving within a specific range.
The upper part of this range becomes the resistance point, where prices fight to rise, while the lower part of the range becomes a support point, where buyers frequently appear.
Range traders want to take advantage of prices by staying in range by taking long positions when prices are near the bottom, or short positions when they are near the top.
Traders can manage risky by imposing stop-loss orders just off the ground in the event of a breakout, which means that any potential losses would be minimized.
Traders waiting for a breakout typically enter buy orders above the range ceiling and sell orders below the range to profit from it.
We must not forget that this strategy carries the risk of a false breakout.
Register with XTB and Start investing online
When to identify a trend?
One of the most fundamental things when identifying a trend in determining the time intervals.
Typically, when analyzing a long-term trend, you are using a long-term timeframe rather than a short-term one.
However, for intraday targeting trades, short-term time frames are of great value.
We could take into consideration that in intraday trading or scalping, using an interval of 1 minute or 5 minutes will be the best tool.
While for swing trading the preferred time horizon of investors is usually established on an hourly or even daily chart.
With a short-term exponential moving average and a longer-term simple moving average on a weekly and daily chart, we could predict the trend direction a little better (learn more about moving averages and identifying trending here).
Identifying the trend helps us when opening operations, but we must bear in mind that markets move in waves.
These waves are called impulse waves when they continue the direction of the trend, and corrective waves when they go against the trend.
By counting the waves or turns in each wave, you can try to predict whether a trading opportunity will be against or in favor of the trend.
So we will be putting the Elliot Wave theory into practice – an impulse wave is normally based on five impulses, and a corrective wave is based on three impulses.
Please click "Introduction of XTB", if you want to know the details and the company information of XTB.


